
← Back to Reports
Monthly Report: July 2026
Net Asset Value - USD / EUR denomination
All statistics are calculated using Robuxio Equities (Robuxio EQ).
Benchmark: S&P 500 (SPY) and 60/40 balanced portfolio.
Reporting transition to the live ETI
Performance through 31 July 2026 reflects the underlying Robuxio Equities portfolio used by the ETI. The ETI starts trading on 10 August 2026. From that date onward, our reports will use live ETI performance.
Portfolio base currency: USD.
1. Performance in July 2026
Robuxio Equities returned -2.6% in July 2026, compared to +0.0% for the S&P 500 and -0.4% for the 60/40 benchmark. NAV value. After fees. USD denomination.
2. Performance YTD
Year to date, Robuxio Equities returned +5.4%, compared to +10.1% for the S&P 500 and +5.8% for the 60/40 benchmark. NAV value. After fees. USD denomination.
3. Performance - 3 Years
Over the trailing three years, Robuxio Equities returned +92.2%, compared to +69.4% for the S&P 500 and +44.4% for the 60/40 benchmark. NAV value. After fees. USD denomination.
4. Volatility
Annualized volatility in July: Robuxio EQ 11.6%, S&P 500 12.1%, 60/40 10.7%.
How We Calculate Rolling Volatility
For each day t, we take the previous 30 daily returns:
ri = (Balancei - Balancei-1) / Balancei-1
Daily Vol = StdDev(r1, r2, ..., r30)
Annualized Vol = Daily Vol × √252
Standard deviation is calculated using the population formula (dividing by N, not N-1). Annualization uses √252 to account for 252 trading days in traditional financial markets.
5. Rolling Correlation
30-day rolling correlation between Robuxio EQ and benchmarks.
Average YTD correlation: Robuxio EQ vs S&P 500 +0.73.
6. The Numbers
Key metrics across Robuxio EQ and benchmarks - Net Asset Value, USD denomination.
July 2026
| Strategy | Return | Max Drawdown | Volatility (ann.) |
|---|---|---|---|
| Robuxio Equities | -2.6% | -4.2% | 11.6% |
| S&P 500 | +0.0% | -3.4% | 12.1% |
| 60/40 Portfolio | -0.4% | -3.2% | 10.7% |
January 2018 to July 2026
| Strategy | Total Return | CAGR | Max Drawdown | Volatility (ann.) | Sharpe |
|---|---|---|---|---|---|
| Robuxio Equities | +792% | 29.1% | -8.2% | 12.5% | 2.11 |
| S&P 500 | +217% | 14.4% | -33.7% | 19.1% | 0.80 |
| 60/40 Portfolio | +118% | 9.5% | -21.7% | 12.1% | 0.82 |
NAV value. After fees. USD denomination.
7. July 2026 Monthly Review
July was a difficult, choppy month for Robuxio Equities. The underlying portfolio returned -2.6% net, compared with +0.0% for the S&P 500 and -0.4% for the 60/40 benchmark. NAV value. After fees. Most of the loss was concentrated late in the month: a 1.9% decline on 29 July was followed by a 2.0% rebound on 30 July, but the recovery was not enough to offset the earlier weakness.
Equity mean reversion was the only positive sleeve, contributing about +0.8%. The main drag was tactical allocation at about −1.8%, followed by crisis hedging at about −0.7%. Equity momentum and short-term tactical each detracted about −0.4%, while real assets trend was approximately flat. The result reflects a month in which short reversals helped mean reversion, but allocation, momentum, and hedging signals did not find sustained follow-through.
Why Crisis Hedging Was a Drag
Crisis hedging is the portfolio's insurance sleeve. It uses tactical positions in VIX-linked ETFs and selected short exposures when the models detect stress conditions such as elevated volatility, deteriorating market breadth, or an adverse trend structure. In July, those defensive positions cost approximately 0.7% as the warning signals did not develop into a sustained equity sell-off and the S&P 500 finished the month marginally higher.
That small drag is an intentional trade-off. Insurance is unlikely to help in every month, and can lose modestly when markets remain resilient or stress fades. The sleeve is therefore kept relatively small and activated selectively to limit its carry cost. Its purpose is not to maximize returns in calm markets, but to provide a convex payoff when a sharp dislocation puts the portfolio's other equity exposures under pressure.
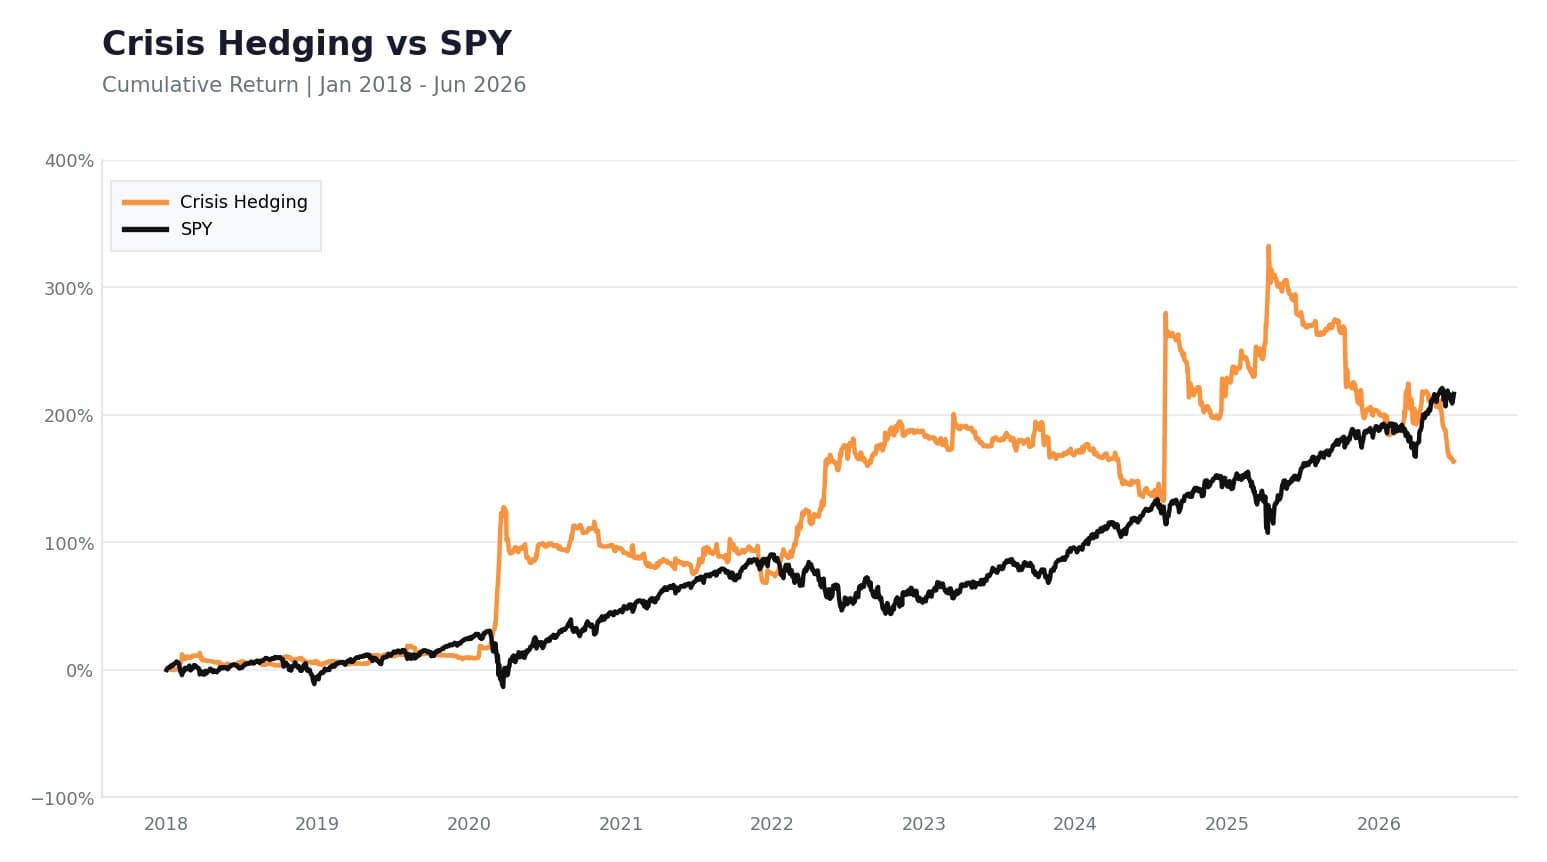
Crisis Hedging cumulative return vs S&P 500, January 2018 to June 2026. Simulated performance. Past performance is not indicative of future results.
Year-to-Date Performance
Year to date, the portfolio remains positive and close to the 60/40 benchmark, while trailing the S&P 500:
| Metric | Portfolio | S&P 500 | 60/40 |
|---|---|---|---|
| Return (net) | +5.4% | +10.1% | +5.8% |
| Annualized volatility | 10.5% | 13.9% | 9.6% |
| Sharpe ratio (ann.) | 0.9 | 1.3 | 1.1 |
| Max drawdown | −7.1% | −8.9% | −5.9% |
Year to date, Robuxio Equities returned +5.4% versus +10.1% for the S&P 500 and +5.8% for the 60/40 benchmark. Realized risk remained below the S&P 500, with annualized volatility of 10.5% versus 13.9% and max drawdown of −7.1% versus −8.9%. The lower return leaves the portfolio's YTD Sharpe ratio at 0.9, compared with 1.3 for the S&P 500. Equity mean reversion and equity momentum remain the main positive sleeves year to date; crisis hedging and tactical allocation have detracted.
Live ETI Reporting Begins 10 August
This report, like all Robuxio Equities reports published to date, presents the performance of the underlying portfolio. The ETI begins trading on 10 August 2026. Performance from that date onward will be reported using the live ETI track record.
For further information, please refer to the following resources:

Pavel Kycek
CEO & Co-Founder, Robuxio
Performance data prior to 2026 is based on backtested results and does not represent actual trading. Backtested performance is hypothetical and has inherent limitations. Past performance does not guarantee future results.
For informational purposes only. This is not investment advice or an offer to invest. Past performance is not indicative of future results. All investments involve risk, including possible loss of capital. Full product documentation and risk disclosures will be provided prior to launch.