A full walkthrough of the Robuxio Equities ETI: why passive exposure is riskier than it looks, the six portfolio sleeves, risk management, historical performance, and how to get access. Recorded live on July 16, 2026.
The problem
The Shortcomings of Traditional Equity Exposure
Stocks are historically the most effective way to build long-term wealth, however, there are significant risks: volatility and prolonged drawdowns, and today's starting point makes both worse.
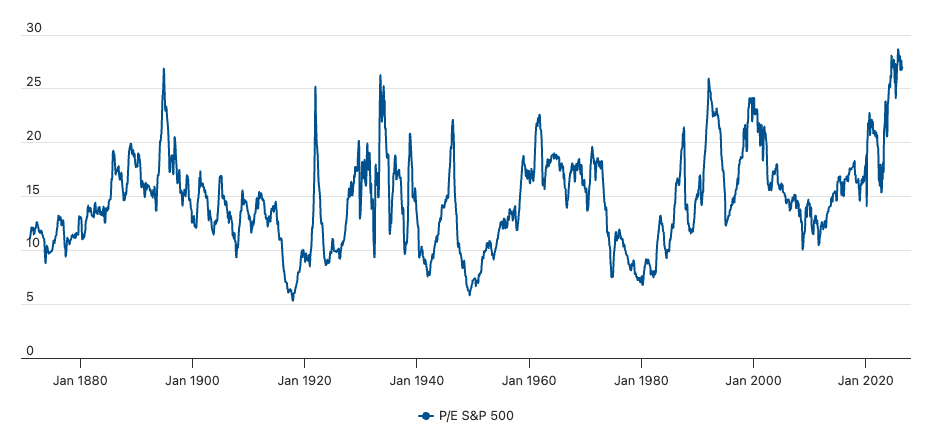
S&P 500 price-to-earnings ratio, 1872 to today.
Valuations Sit Near Historical Extremes
At roughly 27, the S&P 500 P/E ratio is near the top of its range since 1872, a level reached only around the dot-com bubble and a handful of other episodes. Nothing about that forces an immediate correction, but it defines the starting point every passive allocation is buying into.
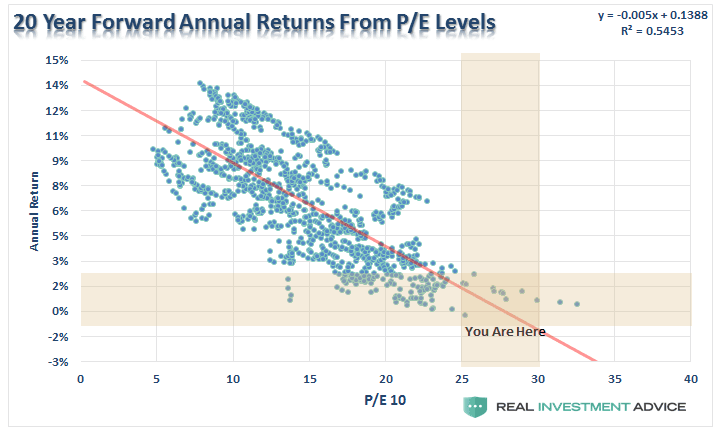
20-year forward annual returns from starting P/E levels. Source: Real Investment Advice.
Starting Valuation Caps The Next 20 Years
Historically, buying the index at valuations like today's has been followed by 20-year forward annual returns averaging around 2% per year, ranging roughly from -0.5% to +2.5%. That is the statistical base rate for passive exposure from here, far below the long-term market average.
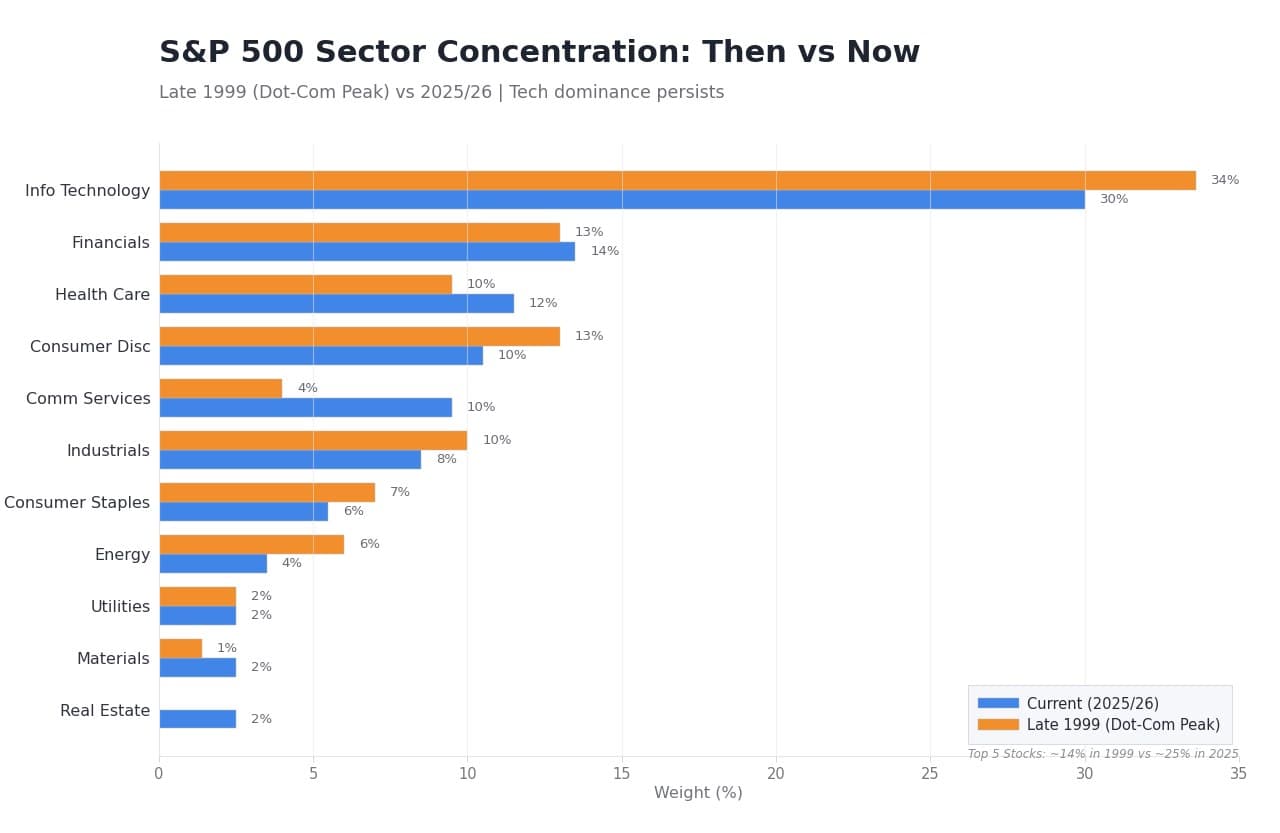
S&P 500 sector weights, late 1999 vs 2025/26.
The Index Is More Concentrated Than In 1999
The technology sector is approaching a 30% share of the S&P 500, mirroring its weight at the top of the dot-com bubble, and the top five stocks carry roughly twice the weight they did in 1999. A passive index position is a concentrated bet on one sector and a handful of names.
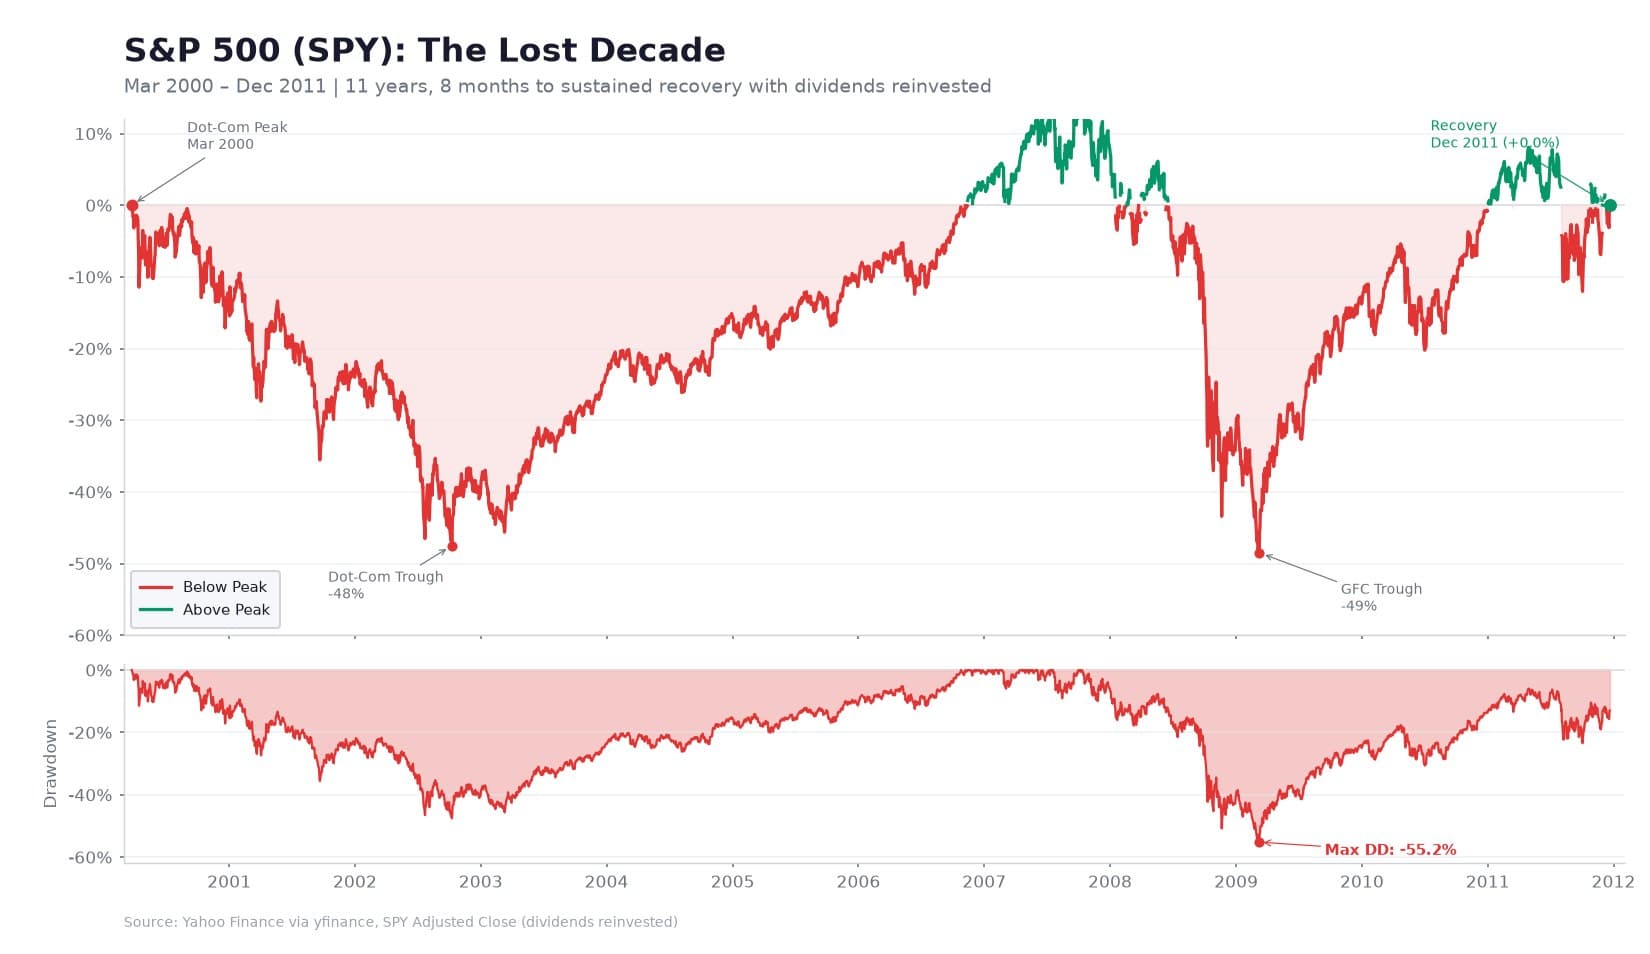
S&P 500 (SPY), March 2000 to December 2011: 11 years, 8 months to sustained recovery with dividends reinvested. Source: Yahoo Finance via yfinance, SPY adjusted close.
Drawdowns Can Last More Than A Decade
From the March 2000 peak, the S&P 500 took eleven years and eight months to sustain a full recovery, with dividends reinvested. Timing around this is not a realistic answer: the last stage of a bubble tends to be the most aggressive run-up, and statistically, the stronger the run-up, the stronger the decline that follows.
The traditional fix, spreading capital across passive equity, market-neutral strategies, a CTA trend program and tail-risk hedging, works on paper but fragments capital and multiplies fees, and no single allocation can reuse the cash sitting in the others.
The solution
One Allocation. Three Return Engines.
Robuxio Equities offers three different forms of exposure that would often require multiple different vehicles, in one exchange-traded instrument. This allows every return sleeve to reuse the same capital.
Adaptive equity beta
Participation in favourable equity regimes, scaled up and down as market conditions change.
Systematic alpha
Return from mean reversion and short-term anomalies that do not depend on a rising market.
Tail hedging
Conditional protection that activates during market stress and stays dormant in calm regimes.
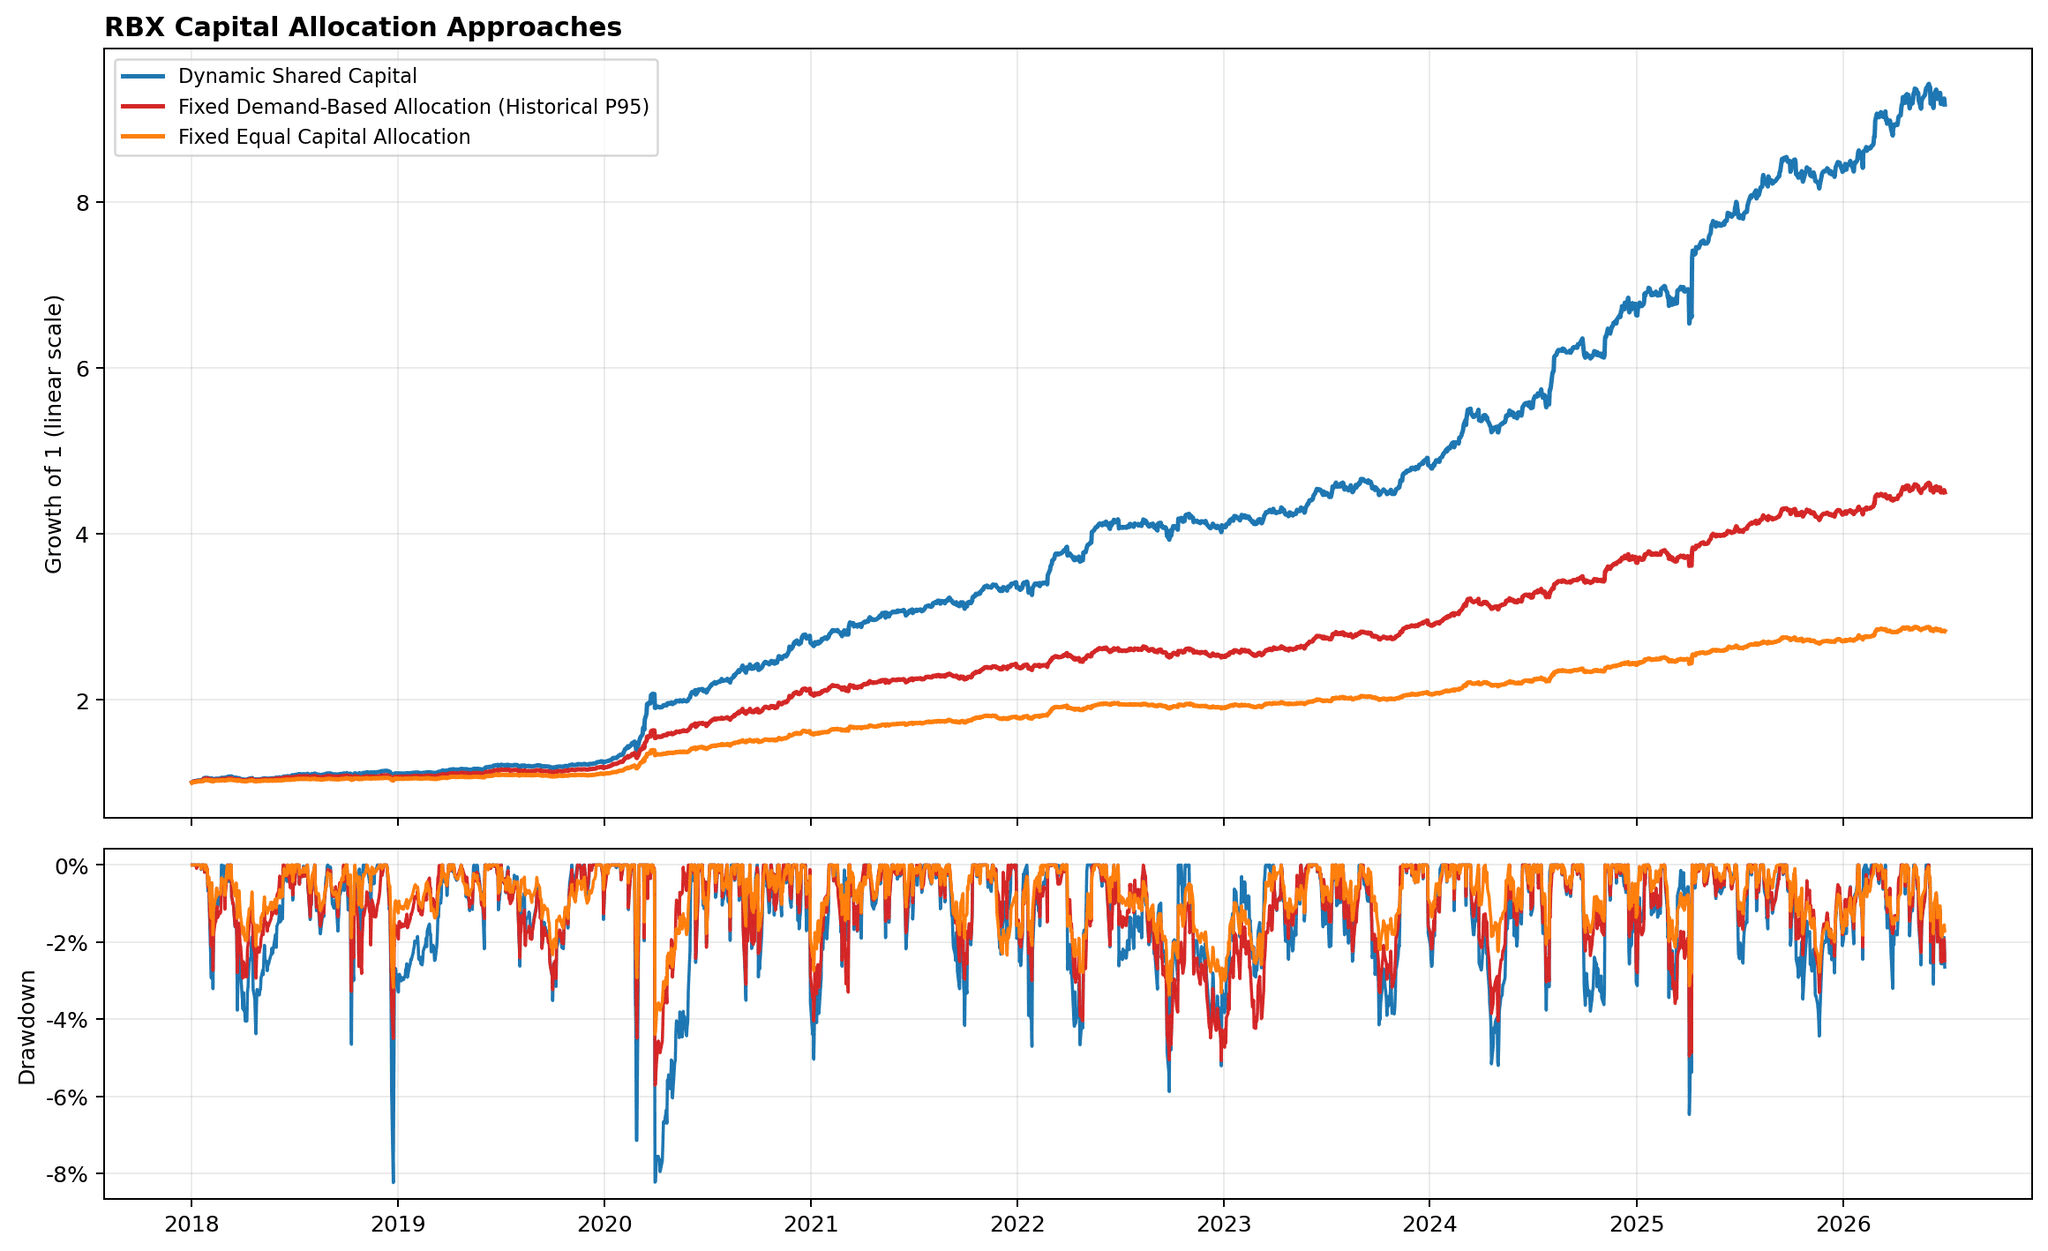
RBX Capital Allocation Approaches: Dynamic Shared Capital outperforms fixed allocation methods by allowing capital to move freely between strategies.Inside the portfolio
Six Complementary Portfolio Sleeves
Each sleeve is a diversified portfolio of its own. Across all six, the portfolio runs roughly 50 signal families (individual trading ideas), each further diversified through different exits and parameter variations into nearly 200 leaf strategies. Sleeve exposures are dynamic rather than fixed: by average gross exposure, tactical allocation is the largest at roughly 34%, followed by equity momentum (23%), equity mean reversion (15%), short-term tactical (11%), crisis hedging (9%) and real assets trend (7%), all drawing on one combined capital pool. Crisis hedging stays deliberately small because its convex volatility instruments deliver a large impact from a small allocation.
≈ 50
Signal families
195+
Leaf strategies
Hours to months
Holding periods
Cumulative PnL by Sleeve
Cumulative sleeve PnL, normalized to the portfolio at the start of the selected period: different engines contribute at different times. Click a legend entry to show or hide a sleeve. Simulated performance. Past performance is not indicative of future results.
Sleeve 1 of 6
Equity Mean Reversion
Buys short-term oversold conditions, expecting a snap-back within days.
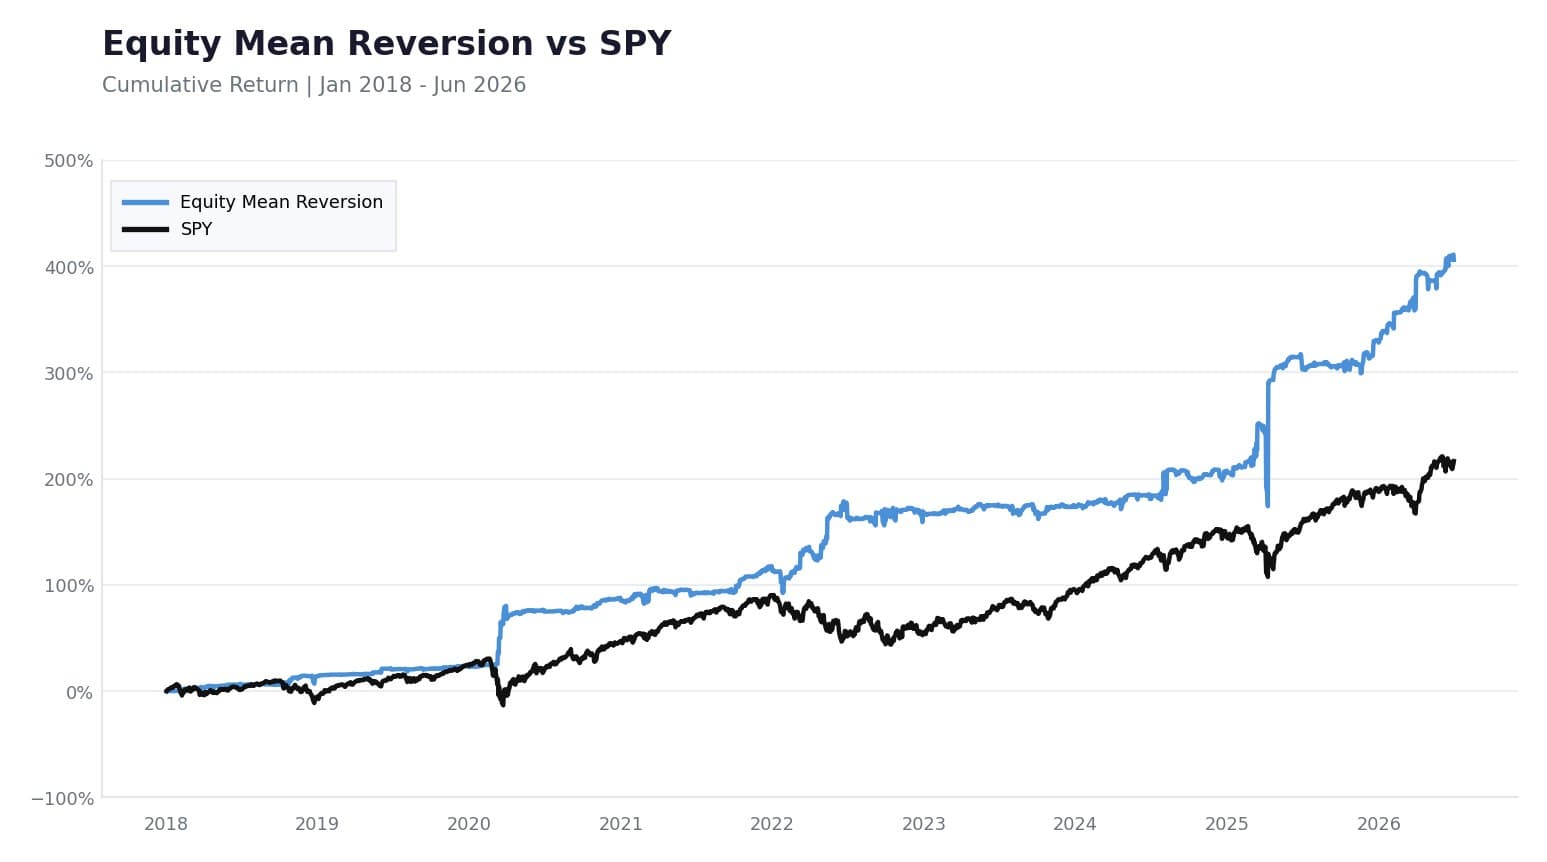
Systematically identifies extreme short-term weakness across equities and bonds and buys into it, exploiting the tendency of prices to snap back after aggressive drops. Entry signals are gated by longer-term trend filters to avoid catching falling knives. The sleeve contributes most when volatility is elevated, as in 2020, early 2022 and the 2025 spring selloff.
Universe
US index ETFs, bond ETFs, sector ETFs, S&P 500 stocks
Holding period
One to a few days
Signal families
5
Leaf strategies
~30
Cumulative return vs SPY, January 2018 to June 2026. Simulated performance. Past performance is not indicative of future results.Sleeve 2 of 6
Equity Momentum
Assets that have been rising tend to continue rising. This sleeve catches those trends.
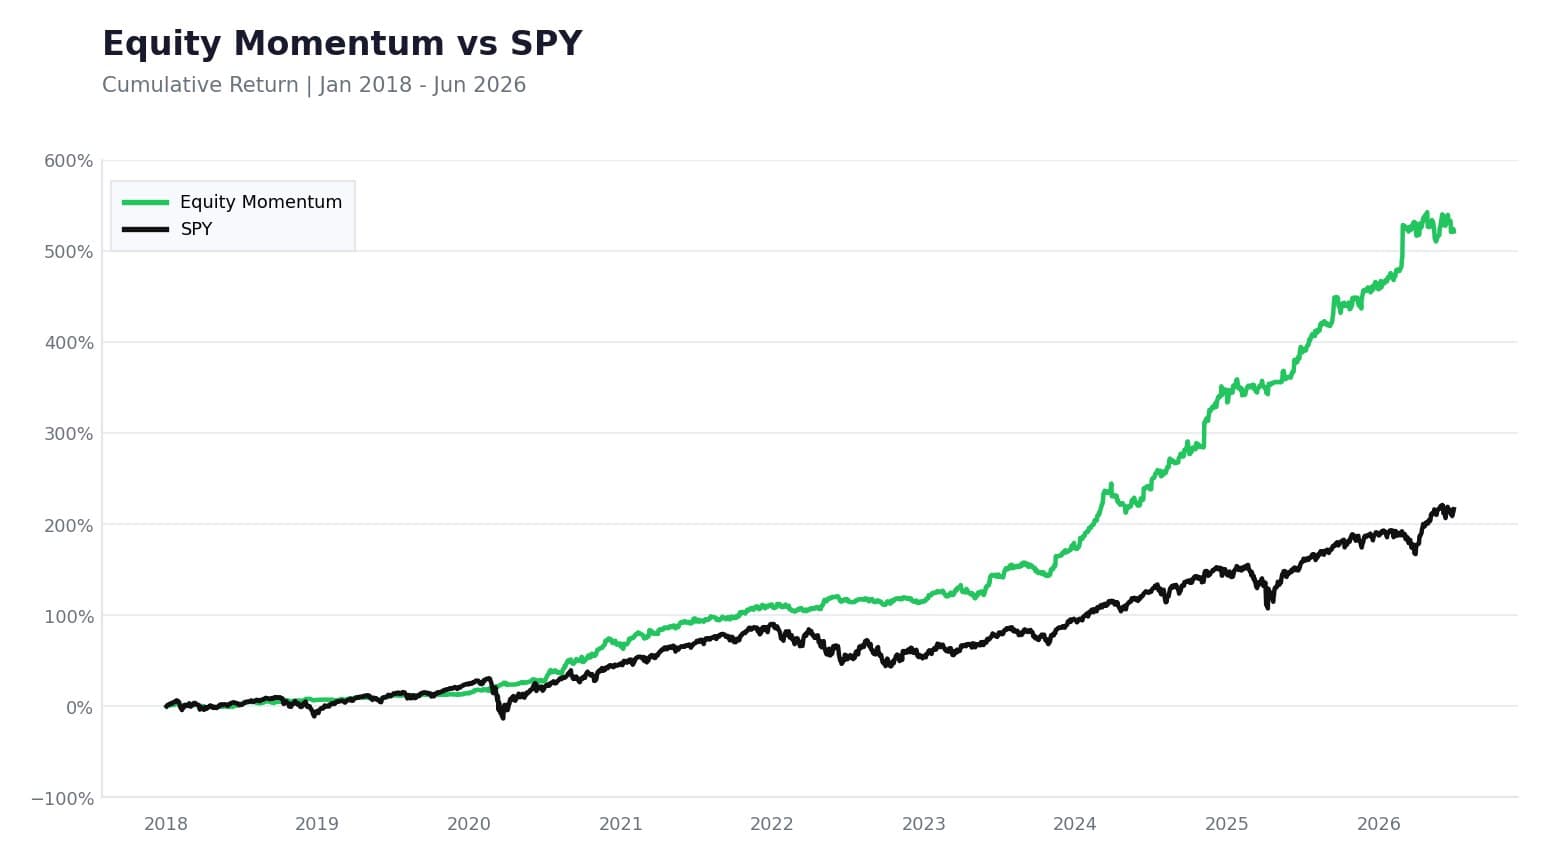
Follows intermediate-term price trends and relative strength across indices, sectors and individual stocks using multiple complementary momentum approaches. It is the backbone of the portfolio in rising markets and steps back when momentum leaves the market.
Universe
US index ETFs, sector ETFs, S&P 500 stocks, large-cap stocks
Holding period
Days to weeks
Signal families
6
Leaf strategies
~15
Cumulative return vs SPY, January 2018 to June 2026. Simulated performance. Past performance is not indicative of future results.Sleeve 3 of 6
Tactical Allocation
Widens the lens to the global opportunity set, adding a non-correlated source of returns.
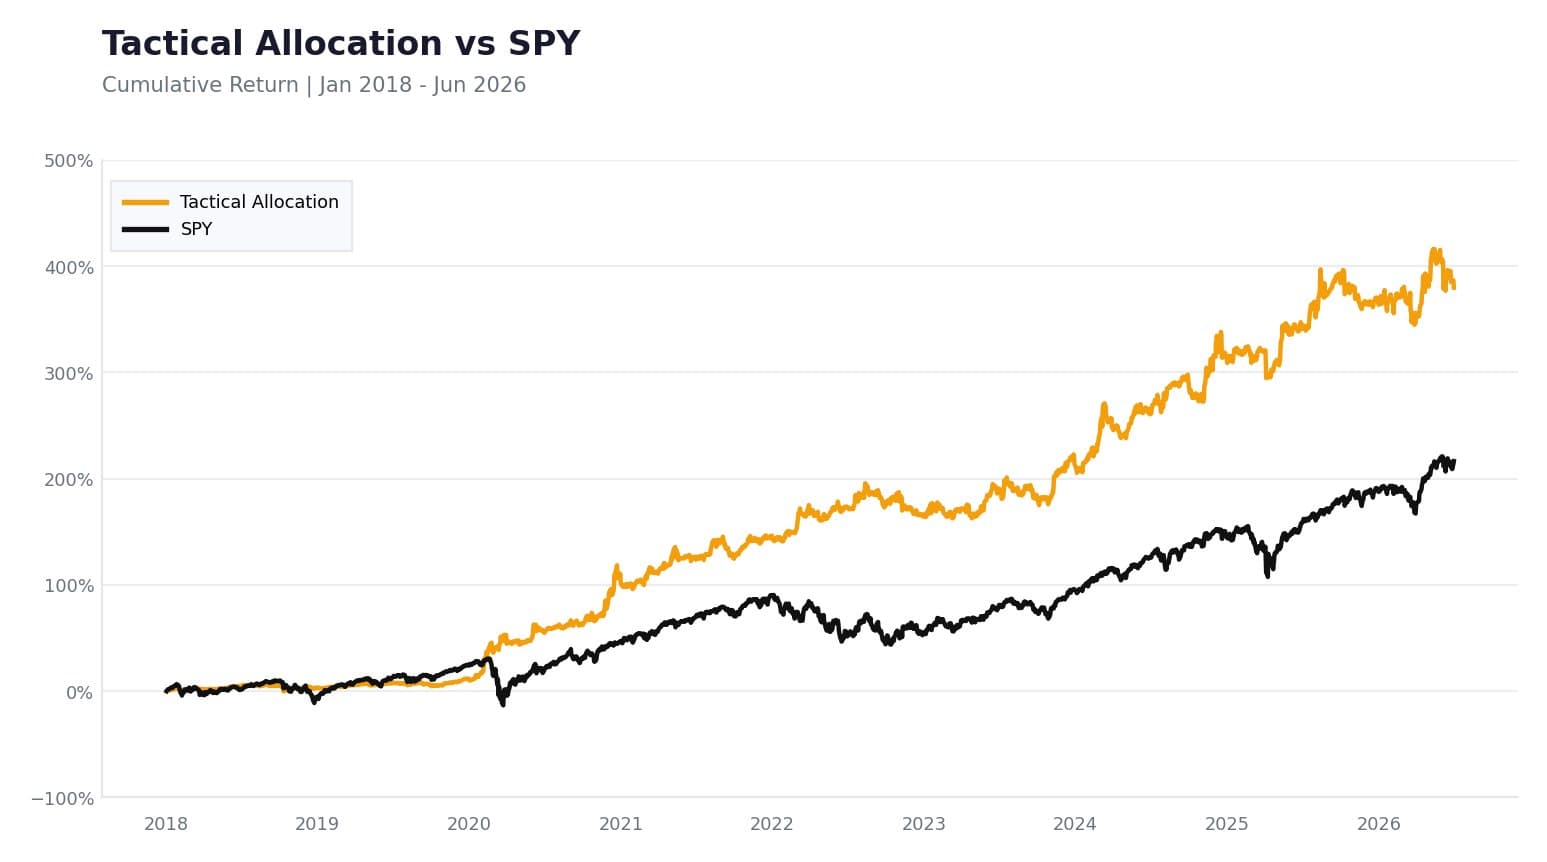
Rotates across countries, sectors, factors and asset classes based on momentum, relative strength and volatility regime signals. Includes equity and bond rebalancing, strategies that detect the early stages of recovery after significant drawdowns, and digital asset trend positions.
Universe
Country ETFs (16 markets), sector ETFs (11), bonds, commodities (gold, silver, oil), emerging markets, value and growth factors, digital assets
Holding period
Days to months
Signal families
10
Leaf strategies
~35
Cumulative return vs SPY, January 2018 to June 2026. Simulated performance. Past performance is not indicative of future results.Sleeve 4 of 6
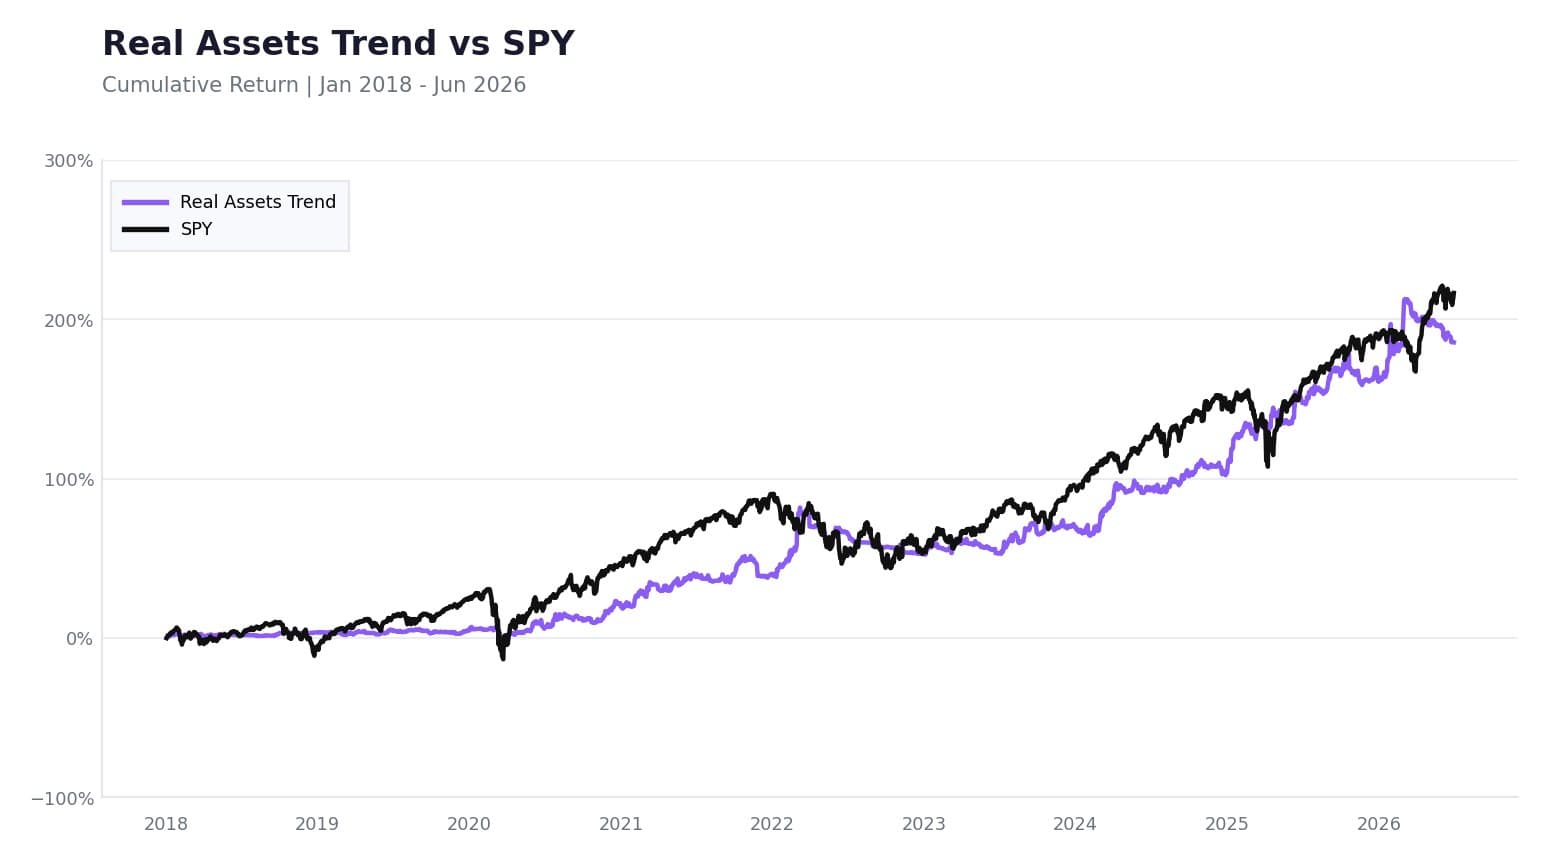
Real Assets Trend
A CTA-style trend program on commodities, uncorrelated to stock beta.
Trend-following on real assets using breakout and moving average systems, with volatility-targeting overlays to stabilize exposure in volatile commodity regimes. Long sideways stretches are normal for trend-following; the payoff arrives when inflation or commodity volatility kicks in, as it did on gold in 2025.
Universe
Gold, oil and energy futures ETFs
Holding period
Weeks to months
Signal families
3
Leaf strategies
~5
Cumulative return vs SPY, January 2018 to June 2026. Simulated performance. Past performance is not indicative of future results.Sleeve 5 of 6
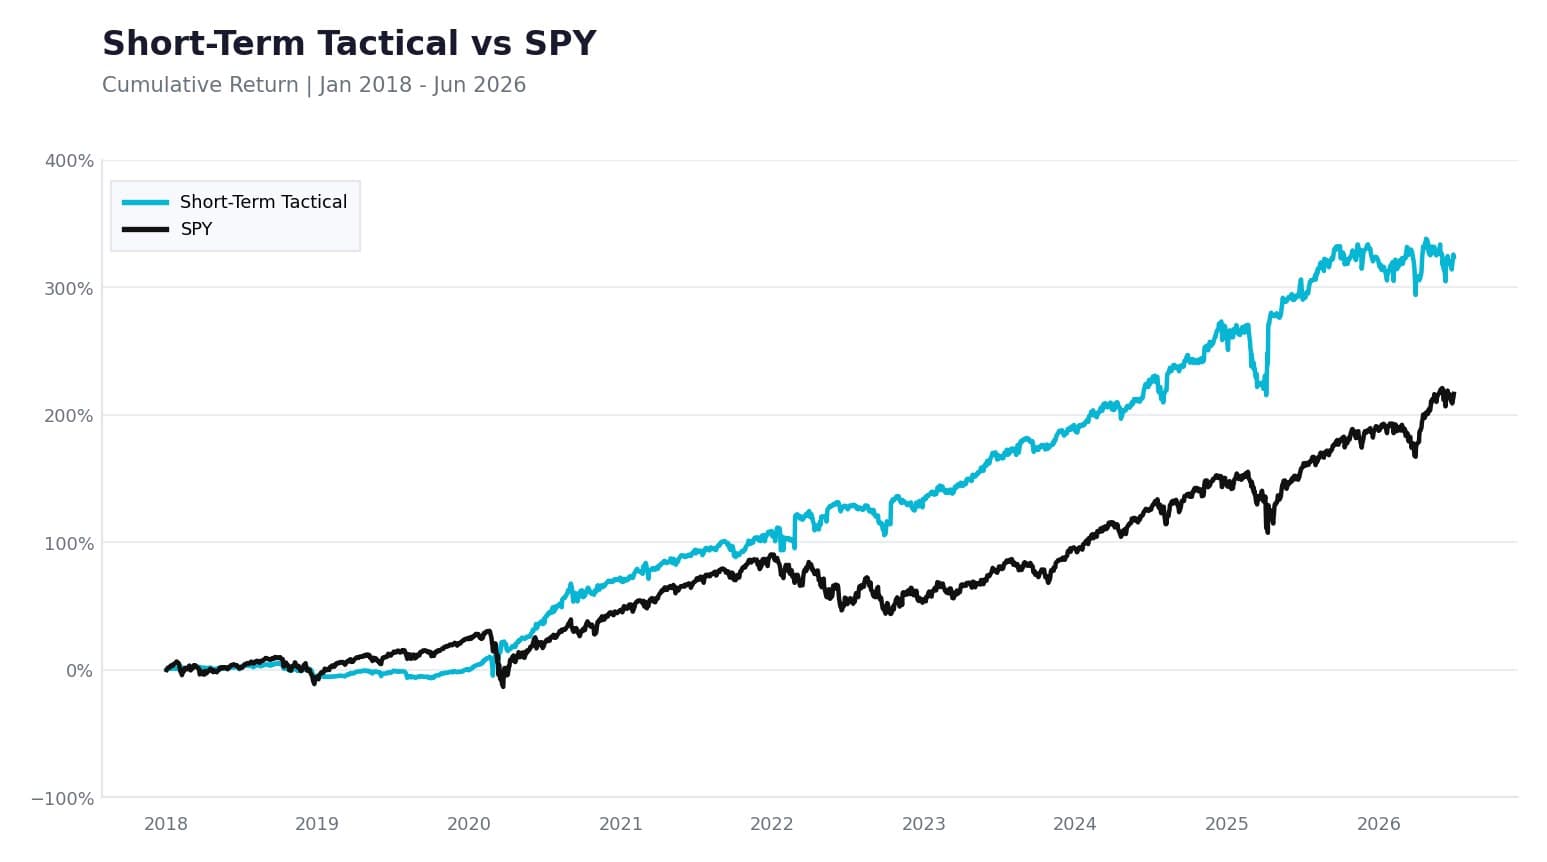
Short-Term Tactical
The largest sleeve by strategy count. The edge is the ensemble, not any single signal.
Harvests short-term alpha from relative strength, mean reversion, regime-conditional, calendar and breadth patterns. Roughly 15 distinct signal ideas applied across many instruments and parameter sets. Because positions are held for hours rather than weeks, it does not need big market moves to contribute, which is exactly what carried it through the low-volatility stretches of 2022.
Universe
US index and sector ETFs, large-caps, emerging market and international ETFs
Holding period
Sub-day to one day
Signal families
~15
Leaf strategies
75+
Cumulative return vs SPY, January 2018 to June 2026. Simulated performance. Past performance is not indicative of future results.Sleeve 6 of 6
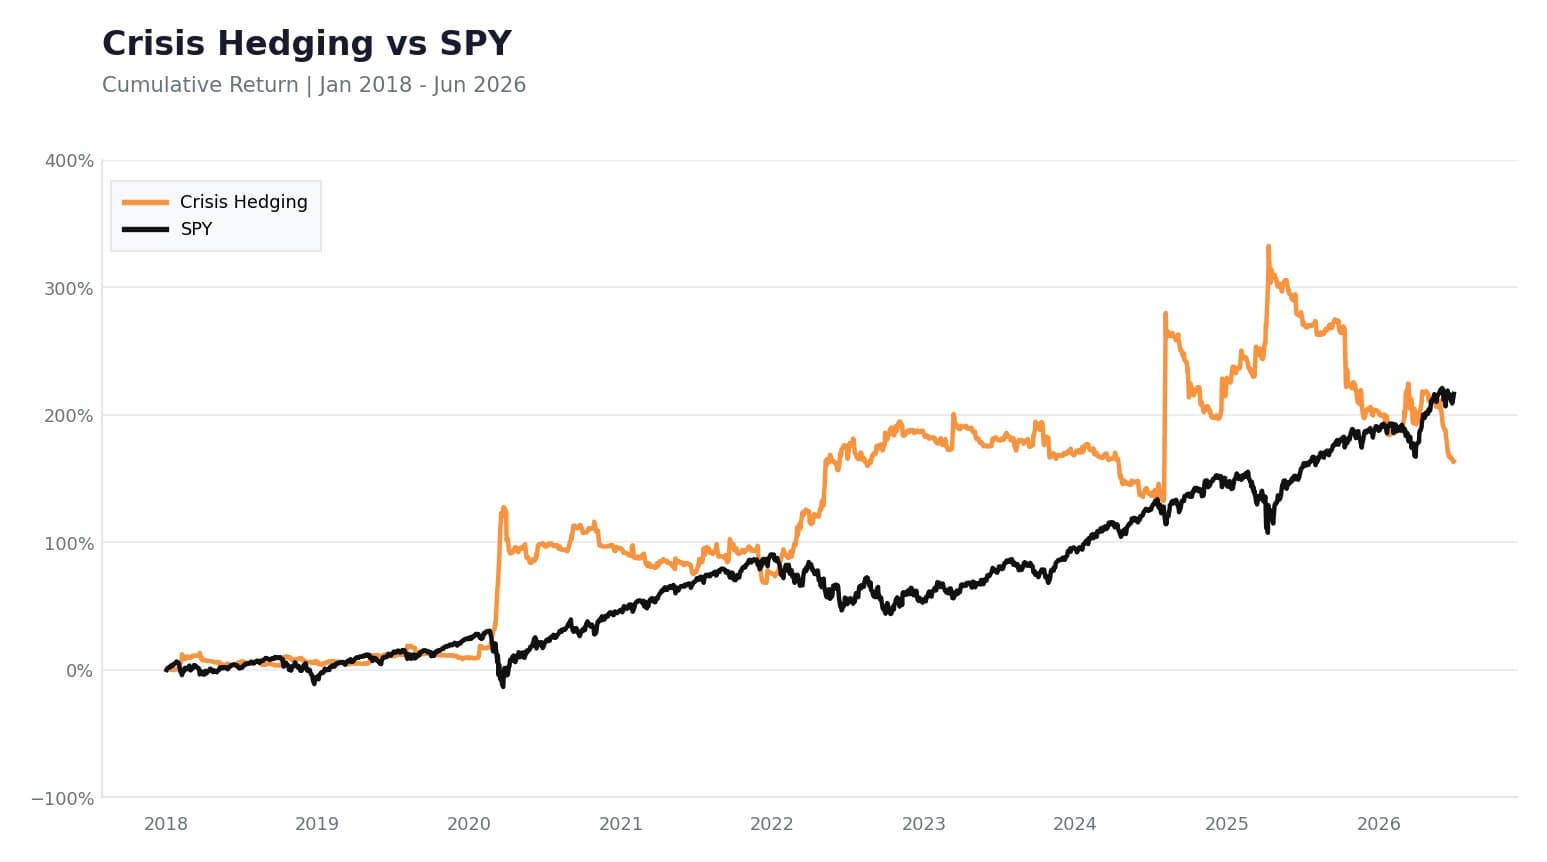
Crisis Hedging
Insurance that activates only when stress conditions are present.
Protective strategies that profit during market stress: long volatility positions, selective equity shorts in weak sectors and overextended rallies, and defensive event positioning. Activated only when elevated volatility, deteriorating breadth or adverse trend structure is detected; dormant during calm markets to minimize cost. Like any insurance, it bleeds slightly in quiet periods and pays off in size when stress arrives. Unlike most tail-hedging programs, no options are used: volatility exposure comes through exchange-traded VIX instruments, so the whole portfolio holds nothing but stocks and ETFs.
Universe
Volatility instruments, US index ETFs, sector, country and EM ETFs, individual stocks
Holding period
Days to weeks
Signal families
~10
Leaf strategies
~35
Cumulative return vs SPY, January 2018 to June 2026. Simulated performance. Past performance is not indicative of future results.
Robustness
Different Engines For Different Regimes
The portfolio is not built around one market view. Each regime has a primary return driver, so the question is never whether the market cooperates, but which sleeve carries the load.
Market regime
Primary engines
Intended behaviour
Strong bull market
Momentum, tactical allocation, equity beta
Meaningful upside participation
Sideways / choppy
Mean reversion, short-term tactical
Harvest reversals and dispersion
Gradual bear market
Crisis hedging, reduced beta
Preserve capital
Inflationary regime
Real assets, tactical allocation
Add non-equity return drivers
Recovery phase
Momentum and recovery signals
Re-enter systematically
Sudden shock
Hedging and portfolio limits
Contain damage and adapt
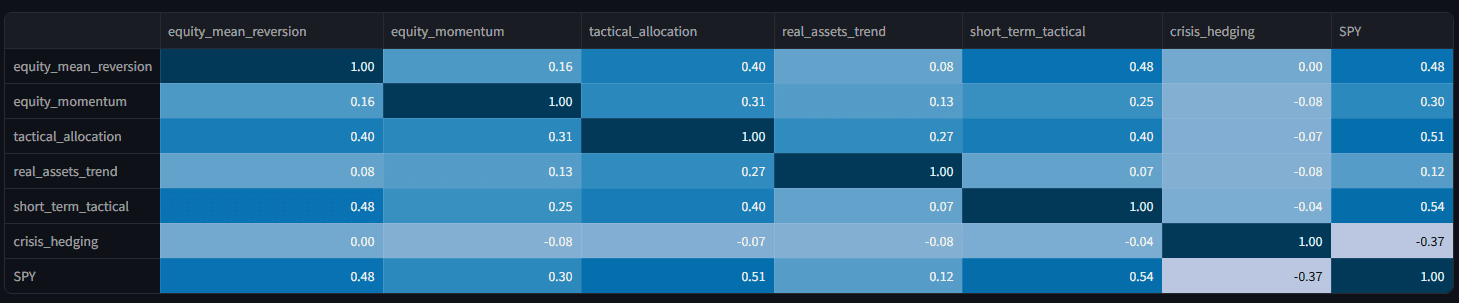
Low Correlation Between Sleeves
The backbone pair, momentum and mean reversion, is barely correlated at 0.16. Real assets trend sits near 0.1 to the equity sleeves, and crisis hedging is negatively correlated to SPY at -0.37, which is exactly the point: it earns when everything else is under pressure.
Correlation of daily sleeve returns. Simulated performance.
Risk management
Strict Risk Management
Diversification is the first layer, but sizing and portfolio limits are enforced systematically at every level of the portfolio.
1
Volatility targeting on the asset, model and sleeve level: more volatile exposures are cut back by sizing.
2
Maximum exposure per single stock.
3
Maximum exposure per single ETF.
4
Maximum exposure per portfolio sleeve, so no single return stream can dominate.
5
Maximum overall gross and net exposure, plus maximum portfolio leverage.
Adaptive Market Exposure
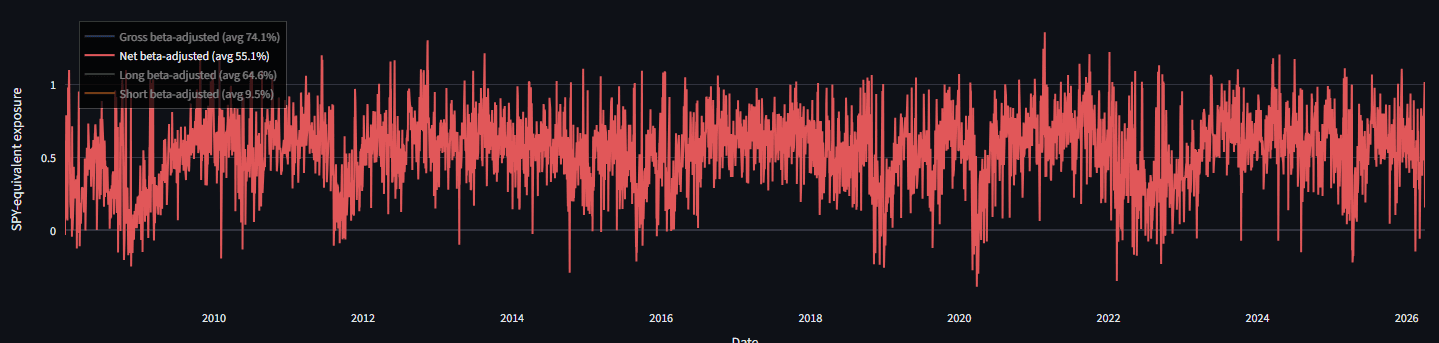
Net beta-adjusted exposure averages roughly 55% of SPY and flexes with market conditions. Net exposure typically runs between 30 and 90%, with gross exposure around 90 to 100%. Leverage is normally below 1x, with a historical maximum under 1.5x.
SPY-equivalent portfolio exposure, 2008 to 2026. Simulated performance.
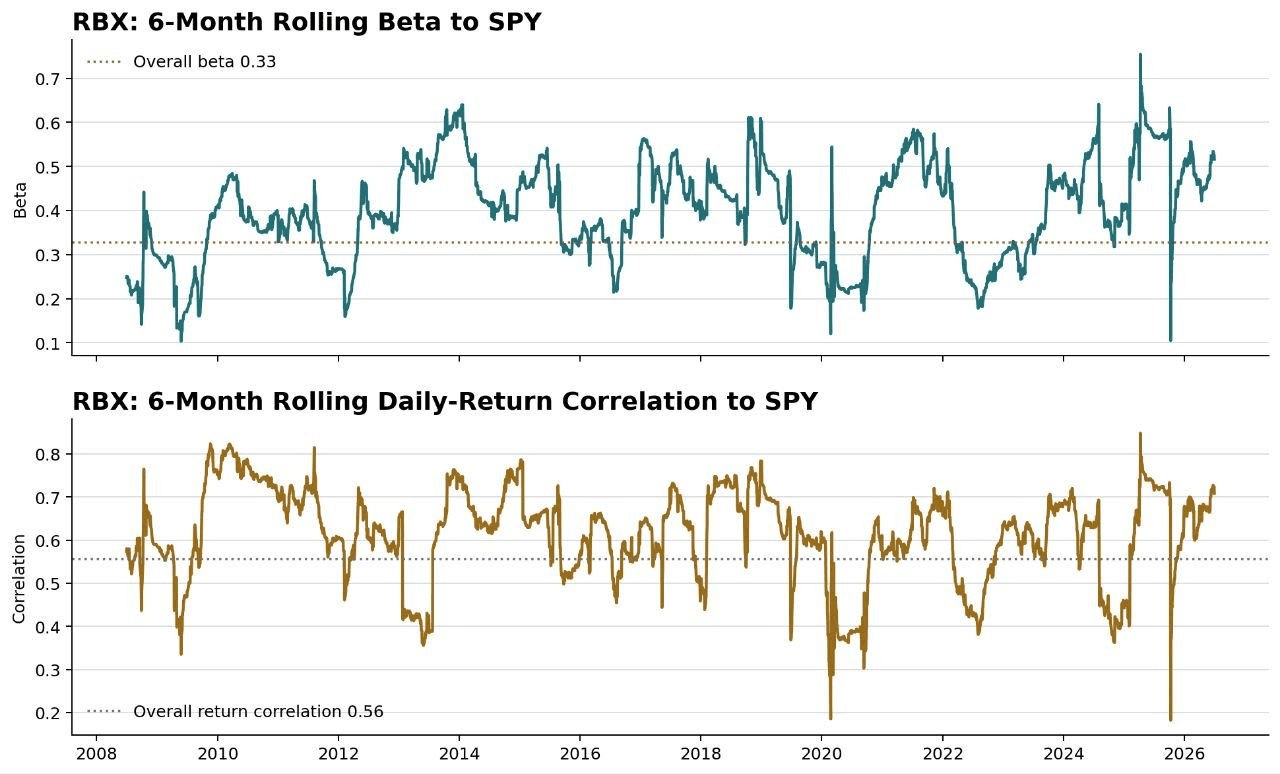
Adaptive beta based on the strength of market momentum: overall beta to SPY of 0.33, return correlation of 0.56. Six-month rolling values. Simulated performance.
Robustness
Behaviour In Market Drawdowns
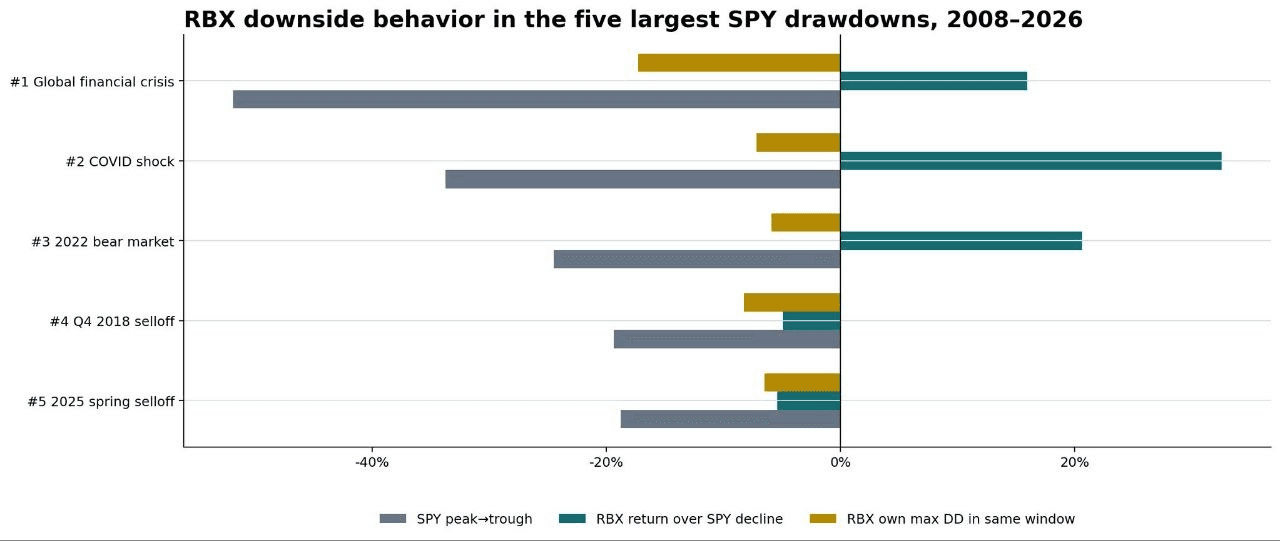
Across the five largest SPY drawdowns since 2008, portfolio drawdowns stayed shallow, with a correlation to SPY drawdowns of just 0.1. In the COVID crash, momentum took the first hit, then hedging, mean reversion and real assets took over, and the portfolio finished the SPY drawdown window ahead.
Portfolio behaviour in the five largest SPY drawdowns, 2008 to 2026. The green bars show where the portfolio ends over the window of each SPY peak-to-trough decline. Simulated performance. Past performance is not indicative of future results.
One honest caveat on the 2008 window: the portfolio was not trading through the global financial crisis, and several of the volatility instruments the crisis-hedging sleeve uses today did not exist yet. The modeled 2008 drawdown is therefore shown without them, even though they would likely have made it shallower, to avoid flattering the backtest with instruments that were not tradable at the time.
Getting out of drawdowns quickly, and keeping them shallow, is the actual secret behind long-term compounding: capital that is not deep underwater can compound from a higher base when the recovery starts.
Expectations
Realistic Expectations
The portfolio targets roughly 20% CAGR after fees with a maximum drawdown around 15%, with typical drawdowns closer to 10 to 12%. It is built for robustness across the full cycle, but there will be periods, from days to months, where it gives back some of its gains.
Environment
Potential challenge
Sudden shock after calm markets
Hedging may activate with a delay
Low-volatility drift
Fewer short-term opportunities
Rapid regime reversal
Momentum and hedging may be whipsawed
Very strong speculative rally
Passive equity may outperform
Process
How Strategies Are Designed
Every model starts idea-first: from a documented market edge, often out of published research, so its expected behaviour is known before a single parameter is fit. That expectation is what each strategy is later judged against.
Robustness testing
In-sample and out-of-sample separation, parameter stability tests, and validation across asset classes, instruments and timeframes, including testing equity models on entirely different markets.
Continuous benchmarking
Every strategy group is benchmarked against how it should behave. A momentum model losing money in a strong momentum market is a red flag that gets investigated, not averaged away.
Managed edge decay
Weights are reduced or models retired as edges fade. With nearly 200 leaf strategies, a single decayed model has negligible portfolio impact and is caught by benchmarking long before it would show in results.
Performance
Historical Performance
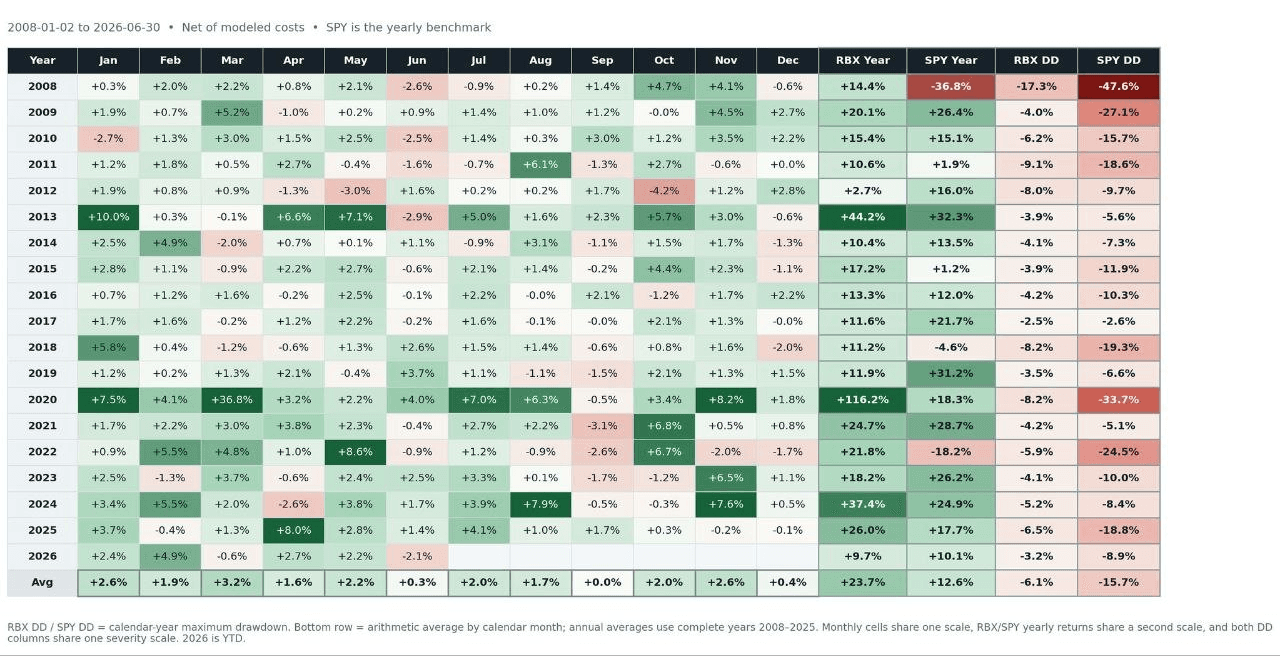
Backtested performance, January 2018 to June 2026, net of modeled costs including fees and slippage, matching the period shown in the chart below. The results mix in-sample and out-of-sample periods: many models carry three to five years of out-of-sample history, and the portfolio's models have been traded live on a seven-figure account since Q3 2024, at different volatility targeting and sleeve weights than the ETI runs. Longer backtests reach back to 2008, and the monthly return table below shows that full history.
Metric
Robuxio EQ
S&P 500
60/40
CAGR
28.5%
14.5%
9.5%
Sharpe ratio
2.08
0.81
0.82
Max drawdown
-8.2%
-33.7%
-21.7%
Annual volatility
12.4%
19.0%
12.0%
Past performance is not indicative of future results.
Robuxio EQ (NAV) vs S&P 500 and 60/40
Robuxio EQ (NAV) vs S&P 500 and 60/40, cumulative return, rebased to the start of the selected period. Net of fees. Past performance is not indicative of future results.
Monthly returns, full backtest, January 2008 to June 2026, net of modeled costs. Annual volatility of 11.6% is comparable to a classic 60/40 portfolio (12.1%), at nearly three times its historical CAGR (21.8% vs 7.9%).
Capacity
Built For Institutional Size
The tradable universe is deliberately restricted to S&P 500 stocks and the 20 to 25 most liquid US ETFs, so the product can scale beyond 100 million in AUM without significant changes to the models.
Most trades execute in the opening and closing auctions, complemented by limit orders through the day. Capacity constraints are estimated as a fraction of the volume traded in those auctions at each price level, informed by the team's experience running an eight-figure systematic account. Costs, fees and unfilled orders are monitored daily, and the smarter order-routing already built for far less liquid digital asset markets can be deployed if execution quality ever calls for it.
The vehicle
An Exchange Traded Instrument With Daily Liquidity
The strategy is delivered through one listed security: an ETI in the form of an Actively Managed Certificate, listed on Börse Stuttgart (EUWAX) under its own ISIN.
ETI
An Exchange Traded Instrument bought and held like a stock or ETF.
AMC
A certificate linked to an actively managed reference portfolio.
Liquidity
Daily liquidity with no lockup period. The exchange price is NAV with fees already accrued daily, settled like any listed security.
Access
Purchased in EUR through the bank or brokerage account you already have.
ISIN
DE000AMC0DZ1
Listed on Börse Stuttgart (EUWAX) and traded in EUR. Available through Interactive Brokers, UBS, Deutsche Bank, and any bank or broker with access to Börse Stuttgart. If your bank does not carry the ISIN yet, it can usually be onboarded on request.
The subscription window opened on July 16. Buying during the window means entering at the issue price of EUR 1,000 per unit with exposure from day one, without facing the initial trading volatility on the exchange. On August 10 the portfolio starts trading fully automated, and after launch the ETI trades daily like any listed security.
EUR. The product currency and issue price are EUR, with an initial issue price of EUR 1,000 per unit.
Have a question that is not covered here? Send it to team@robuxio.com and it will be answered in the next Q&A update.
For informational purposes only. This is not investment advice or an offer to invest. Charts labelled as simulated show backtested performance net of modeled costs; live results may differ. Past performance is not indicative of future results. All investments involve risk, including possible loss of capital. Availability depends on your jurisdiction and broker; read the base prospectus and KID before investing.