2025 Annual Report
Throughout 2025, many prominent voices described the crypto market as being in a growth phase, yet the Top 50 crypto futures index fell 73% and Bitcoin posted a negative return. This report addresses what drove that disconnect and how we navigated it.
1. The Market by the Numbers
2025 Was a Bear Market
One of the most common mistakes in crypto analysis is evaluating the entire market based solely on Bitcoin. When you look at the broader picture, 2025 was unambiguously a bear market.
Our Top 50 Index, which tracks the fifty most liquid coins on Binance Futures (rebalanced daily), finished the year down approximately 73%.
Top50 equally weighted Binance futures, rebalanced daily. 1/1/2025 - 31/12/2025
Altcoin Performance Mirrored 2022
With hindsight, no one describes 2022 as a bull cycle. Yet when you compare the altcoin performance between 2022 and 2025, the patterns are remarkably similar.
Top50 equally weighted Binance futures, rebalanced daily. 1/1/2022 - 31/12/2022
Bitcoin's Relative Underperformance
Despite strong performance in traditional assets (the S&P 500 and gold both posted significant gains) Bitcoin ended 2025 with a loss of approximately 6%.
Year-to-date performance comparison. 1/1/2025 - 31/12/2025
2. A Tale of Two Volatility Regimes
From a volatility perspective, 2025 can be split into two distinct market regimes:
First Half (January–June)
Volatility was declining but remained elevated enough to create favorable conditions for our portfolios. This period still featured good momentum, sufficient volatility, and short-term trends we could capture. Our short-term momentum strategies perform well in this environment, which is why we were able to profit from the brief but tradeable moves that occurred. Long-term momentum approaches, by contrast, generally struggled during this period.
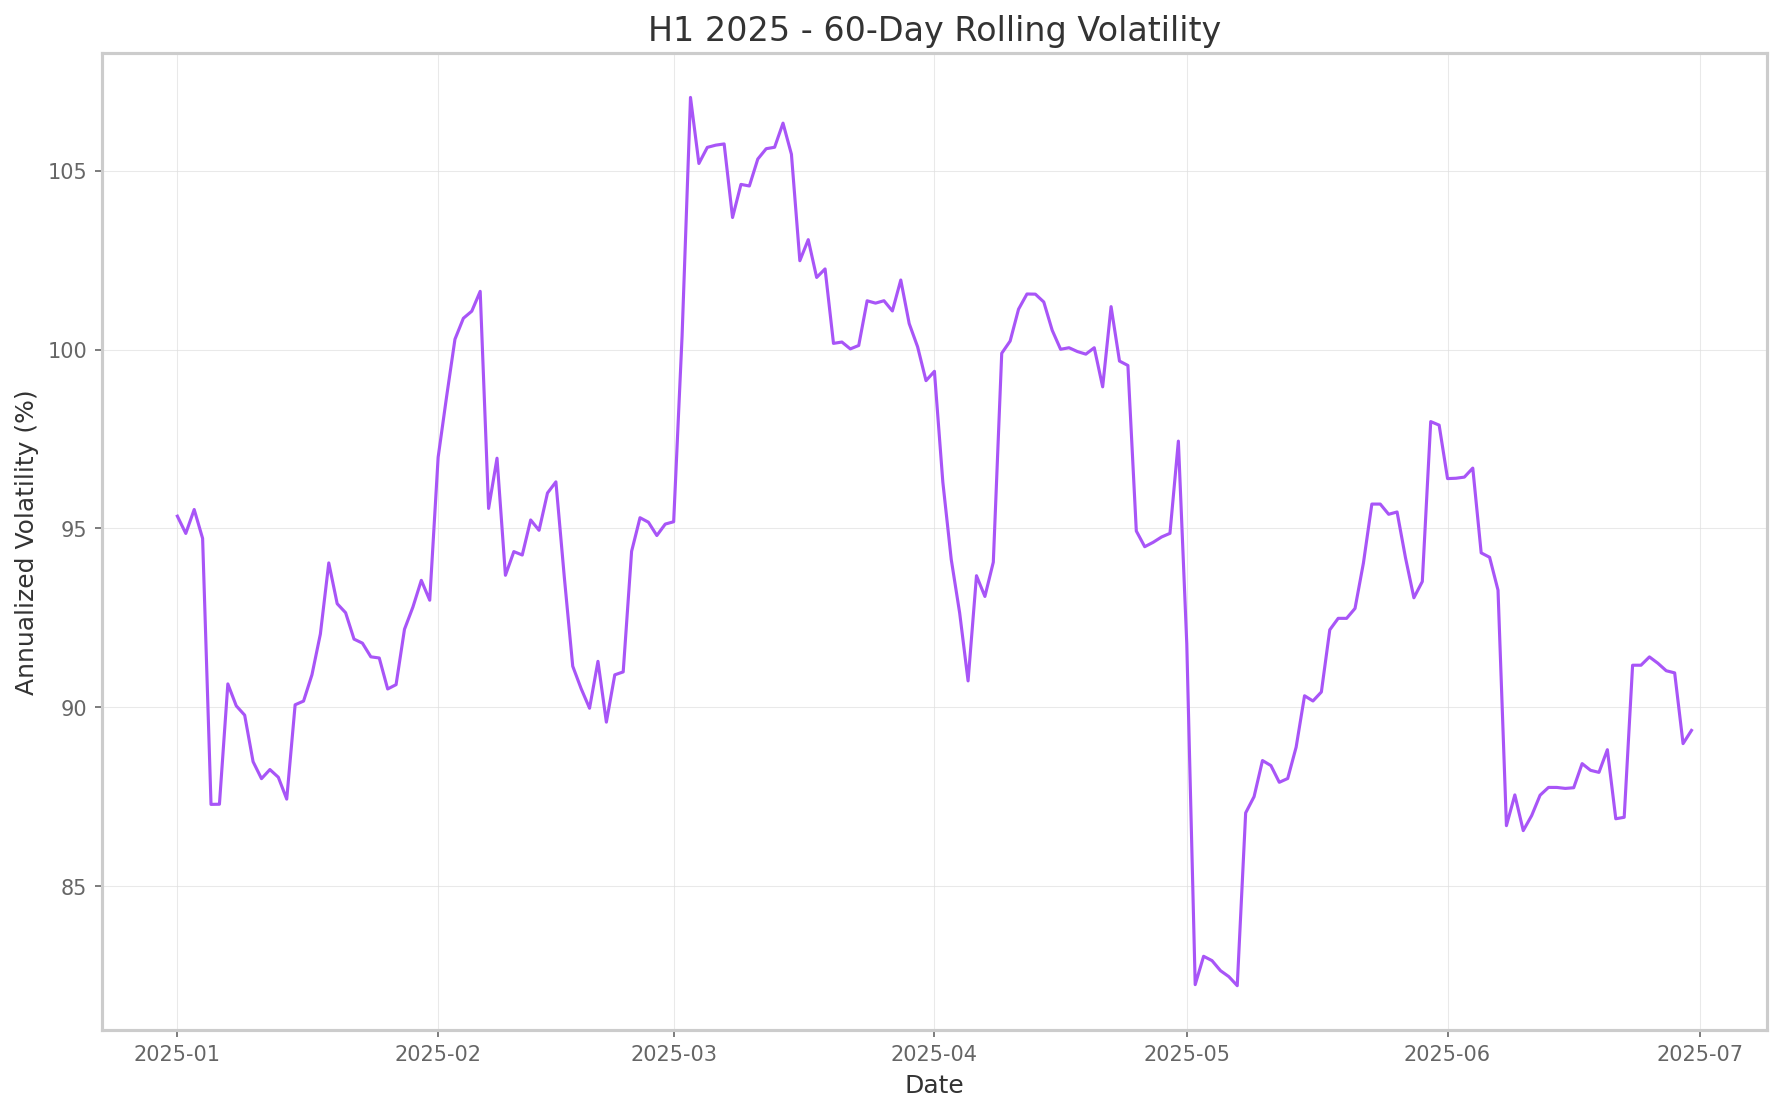
60-Day Rolling Annualized Volatility (%)
Second Half (July–December)
This is where our drawdown developed. August and September 2025 saw the lowest volatility of the year, which is a challenging environment for directional trading. Then came October 10th, the largest liquidation event of the year. For our models, which have an average holding time of 1.8 days, these extremely short-term volatility spikes are primarily about risk management. Preserving capital matters more than maximizing gains. We navigated that day well, finishing in positive territory. The remainder of the year saw volatility continue its decline, reaching particularly low levels by December.
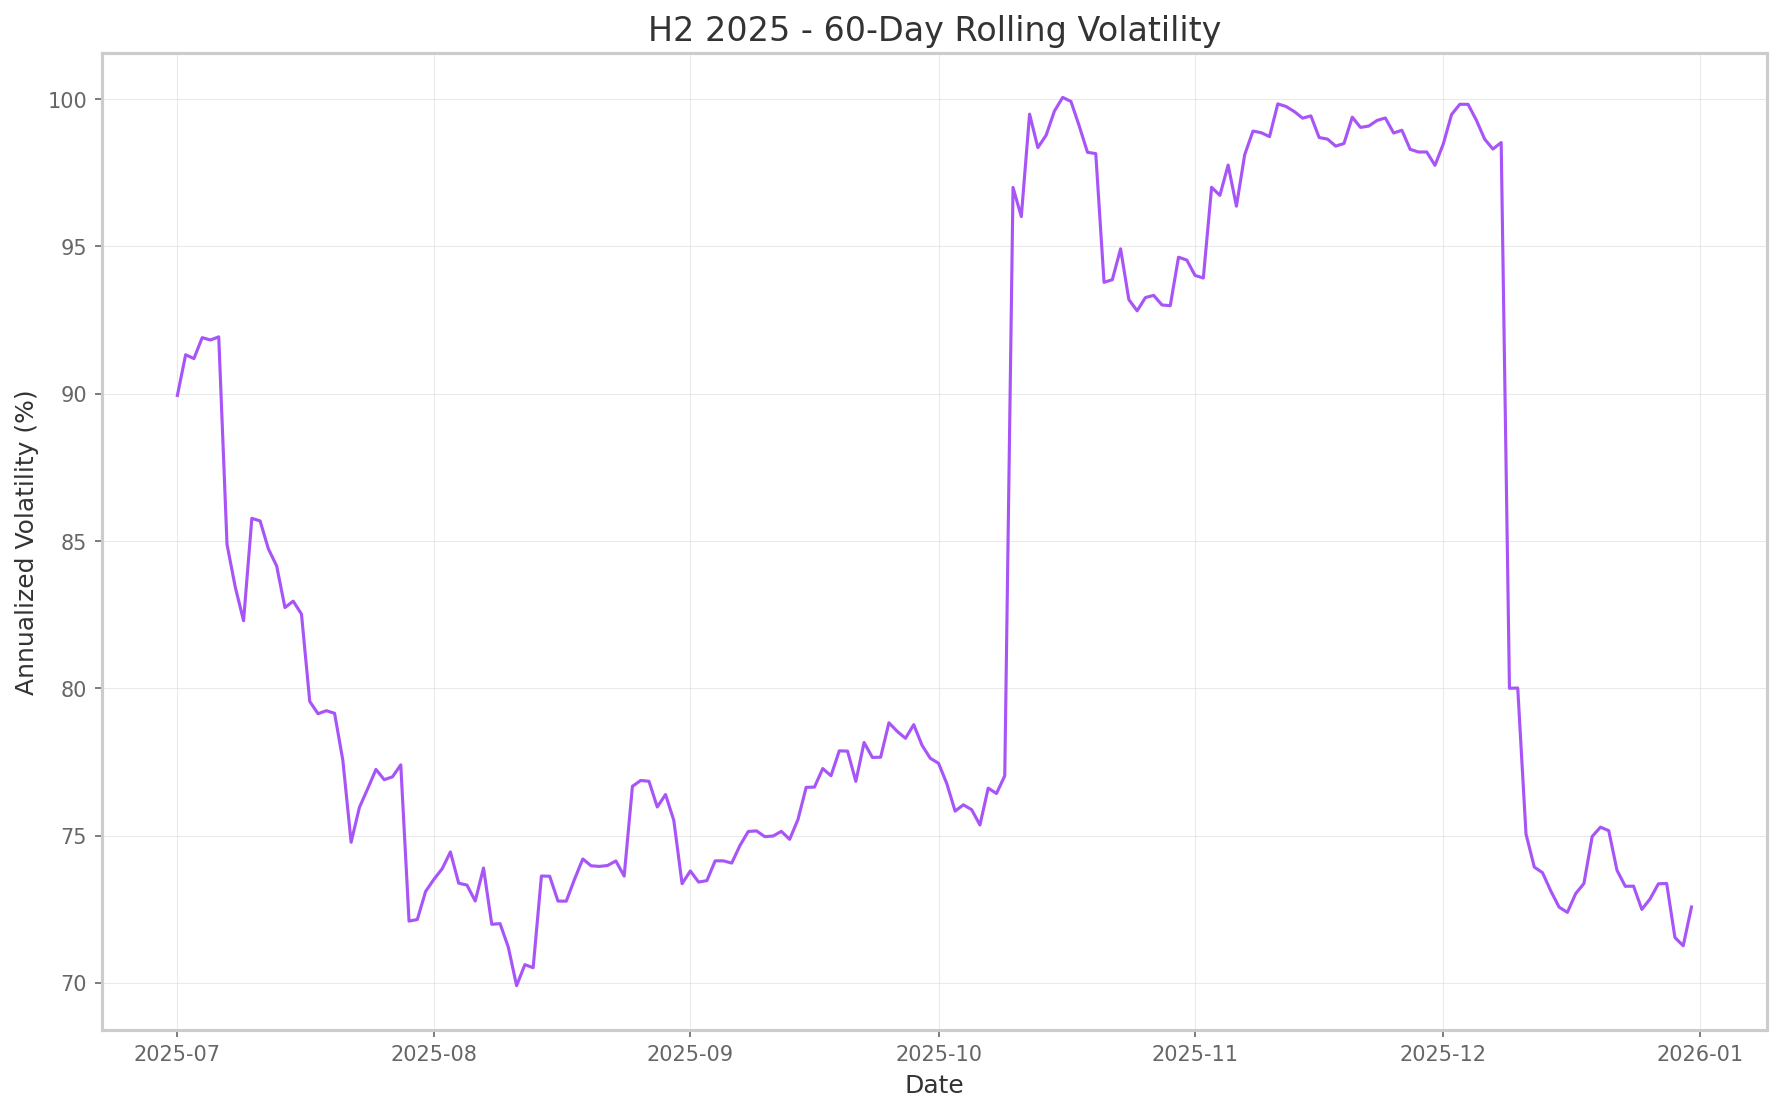
60-Day Rolling Annualized Volatility (%)
For additional clarity, below is a chart with the October 10–20 period removed. This shows the underlying market state and reduced volatility regime without the distortion of that brief but extreme liquidation event.
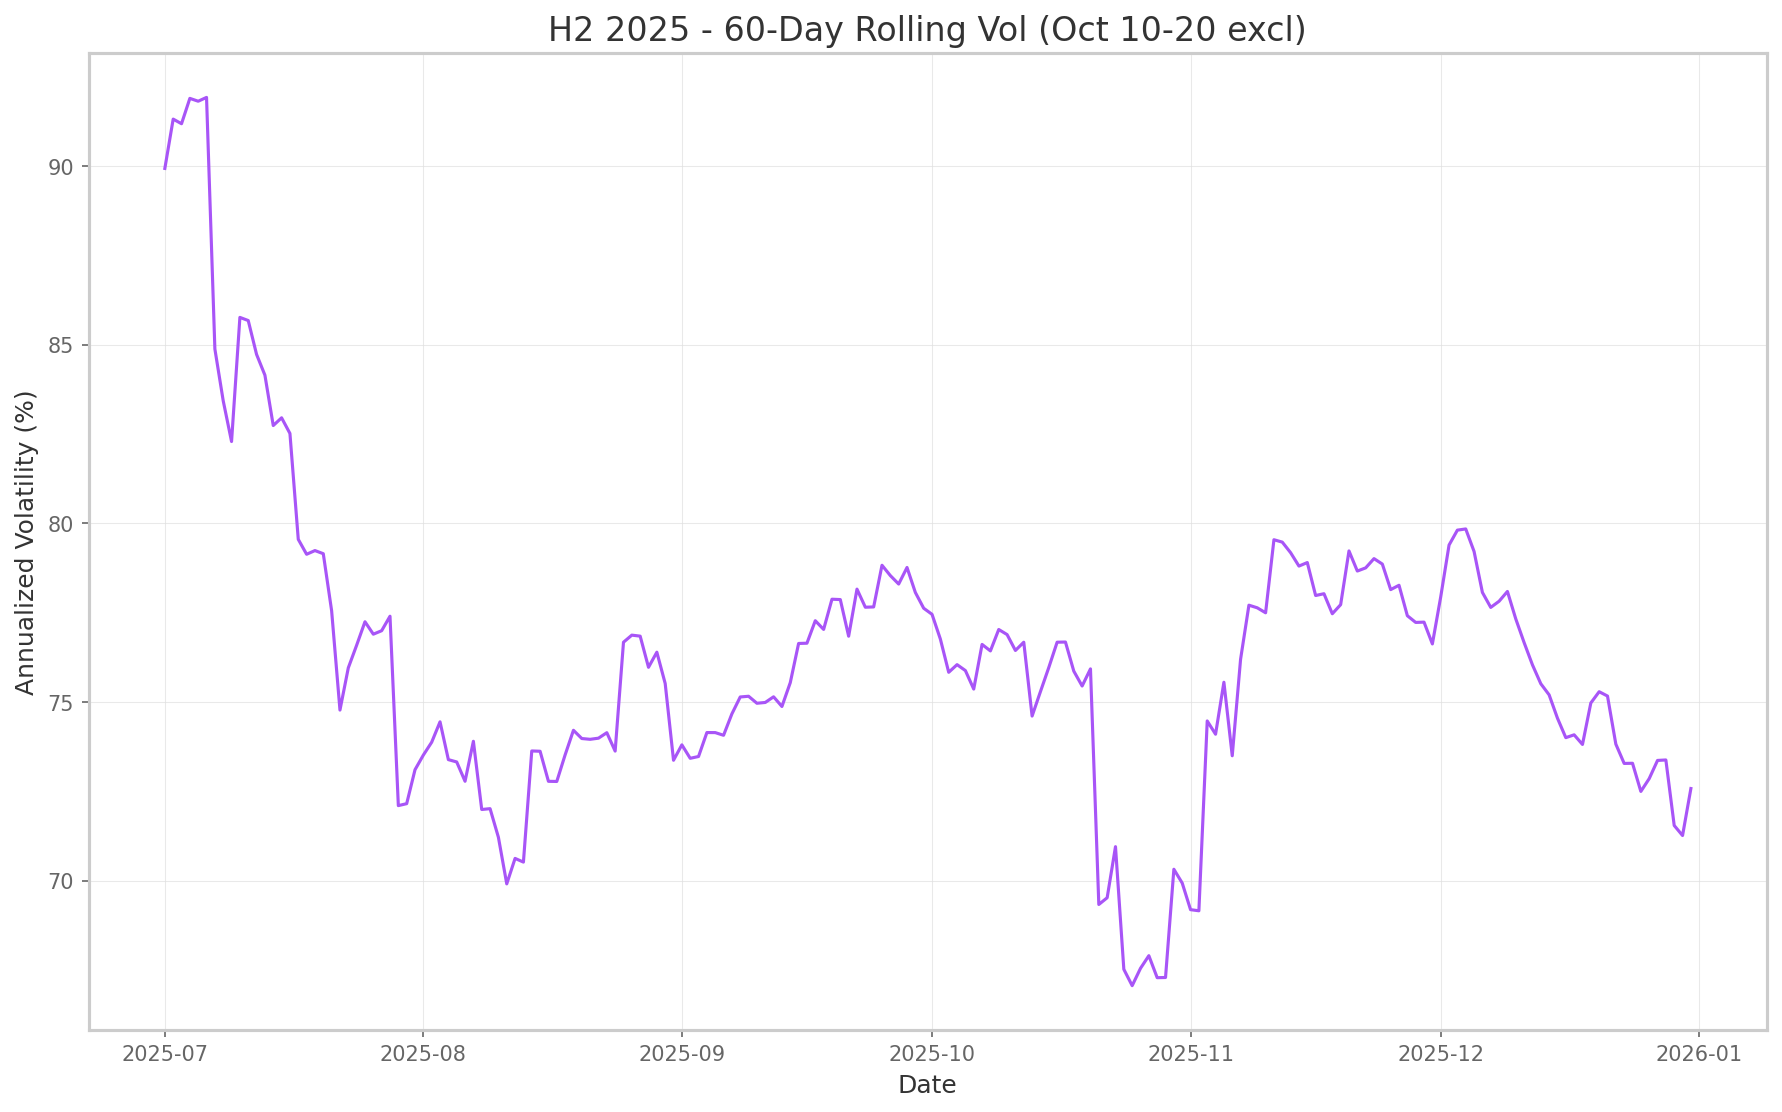
60-Day Rolling Annualized Volatility (%)
3. New Listings and Post-Launch Price Dynamics
Binance listed a significant number of new tokens in 2025, often with high daily volume at launch. The pattern consistently showed high initial volume, followed by steady persistent decline.
Median Performance of Binance Futures Symbols Listed in 2025
4. The Robuxio Trading Approach
Broad Strategy Diversification
We trade over 20 strategies spanning both momentum and mean reversion approaches. Each strategy can hold up to 20 positions, and each position can be spread across up to 5 sub-positions through parameter offsetting. Sub-positions can be further distributed using various weighted average price techniques. This eliminates strategy selection bias, ensuring we're not betting on one approach being right.
Broad Tradable Universe
Our trading engine ranks the entire crypto futures market daily based on liquidity metrics, selecting the top 40–50 coins that meet our criteria. This process eliminates coin selection bias.
No Directional Bias
The crypto market has a well-documented short-term bias toward the long side, with long strategies carrying a more statistically significant edge. But shorts are tradeable too. As part of our all-weather approach, we trade both directions.
Mid-Frequency with Robustness First
We know that edge decay in crypto happens faster than in any other market. Our protection against this is building models that are mid-to-low frequency with high original expectancy. Research consistently shows these models decay more slowly, particularly when based on simple, transferable edges that work across asset classes. The single most important criterion for a model to enter our portfolio is a minimum exptectancy of 1%, preferably 1.5% or higher.
Advantages of this approach
Our trading approach has the following advantages:
- Robustness - Non-optimized, simple models that work across asset classes
- Unbiased - All directional approaches and directions represented
- Broad market coverage - No concentrated bets on a handful of historically successful coins
- High diversification - Across many coins and many strategies
- Conservative leverage - Maximum net exposure of 1x, eliminating liquidation risk
- Low single coin risk - Smaller coins receive smaller allocations
- Low single approach risk - No single approach can sink the portfolio
Disadvantages of this approach
As always in trading, there is no free lunch. We pay for the advantages above with following disadvantages:
- Slower reaction time - We don't catch rapid market changes, particularly intraday or 1–2 day moves
- Extended drawdowns - Mid-frequency trading means longer time in drawdown when conditions turn unfavorable
- Underperformance in low volatility - We need some level of volatility to generate returns
- Longer investment horizon required - Properly evaluating this approach requires a multi-year perspective
A Note on Outliers
Our exposure to smaller, more volatile coins cuts both ways. These coins can move 100%+ in a single day during high volatility periods, which is one reason we perform well when volatility spikes. Negative outliers are also part of the equation. We manage this through position constraints and advanced volatility targeting, which automatically reduces allocation to highly volatile, lower quality coins. More on that later.
5. Performance Since Launch
Our High Sharpe portfolios launched for select clients in July 2024. Here's the out-of-sample performance since then:
HSLV and HSHV portfolio performance vs Top50 Index and Bitcoin. July 2024 onwards.
Note: For simplicity all the performance metrics in this report are based on our USDT collateralized portfolio offerings run on Binance. Variance from the displayed performance can arise due to differences in exchanges (different tradable universes), collateral (BTC, ETH ot USDT), VIP tier (trading fees will differ, and trading account type (PM Mode or Futures Classic Mode).
Understanding When Directional Portfolios Perform
Over large datasets, we can identify which market environments favor or challenge directional strategies. Ranked from most favorable to least.
Directional market + rising volatility
2025 examples: February decline, May rally
Directional market + stable or moderately declining volatility
2025 example: July growth
Non-directional market + rising volatility
Did not occur in any meaningful duration during 2025
Non-directional market + declining volatility
2025 example: August–September
Performance 2025
HSLV and HSHV portfolio performance vs Top50 Index and Bitcoin. 1/1/2025 - 31/12/2025
First half (January-July)
Our portfolios captured the higher volatility and short-term trends effectively. At peak, our HSHV portfolio outperformed both Bitcoin and the broader market. Given the challenging conditions for passive crypto holders (the Top 50 finished down 73%), this period represented strong risk-adjusted performance.
Second half (August-December)
This period brought an above-average drawdown, driven by two overlapping factors: the unfavorable market regime and a cluster of negative outliers. Let me explain each.
The Drawdown Cause
Market Regime
August and September had the lowest volatility of 2025. The market moved sideways. Statistically, this is precisely the environment where our approach builds drawdowns. This is the expected behavior of our approach during such conditions.
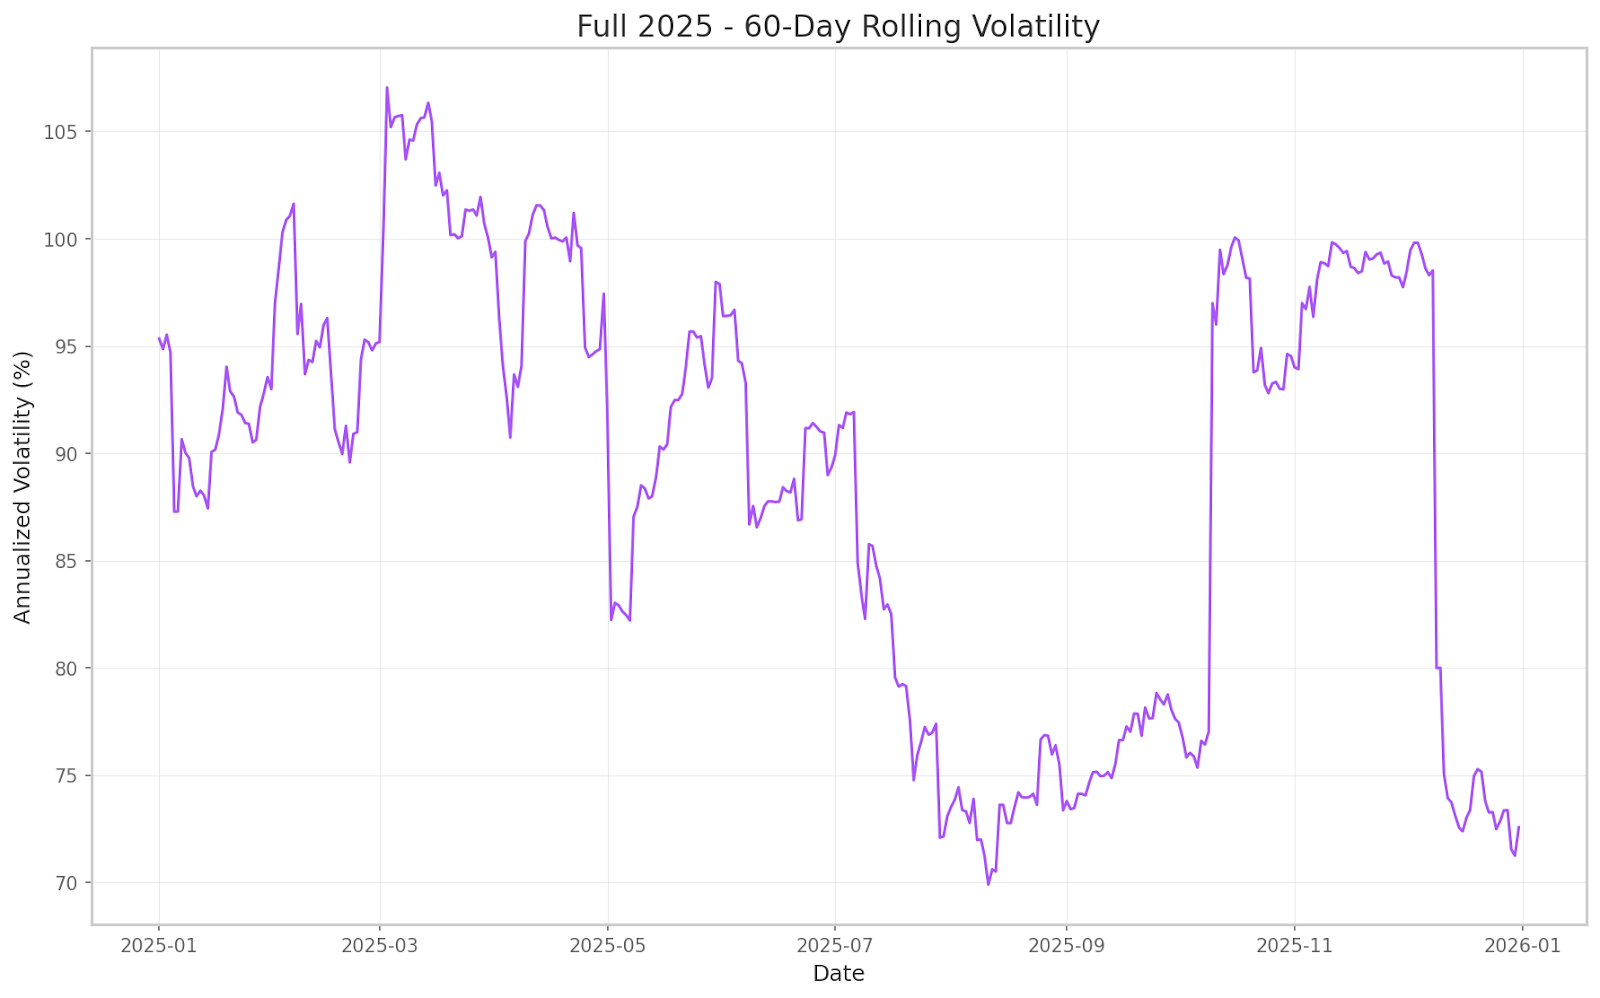
60-Day Rolling Annualized Volatility (%). 1/1/2025 - 31/12/2025
Negative Outliers
The natural drawdown from market conditions was amplified by an unusual clustering of negative outliers.
As noted earlier, we intentionally maintain exposure to highly volatile smaller coins because, over time, this pays off substantially. Negative outliers are always part of trading smaller coins, which is why we have to both expect and plan for them.
What changed in 2025: Binance began onboarding more projects that were essentially vehicles for exit liquidity. These coins passed our liquidity filters because they launched with high volume, often driven by initial listing activity rather than sustained interest. They entered our tradable universe more frequently than in previous years.
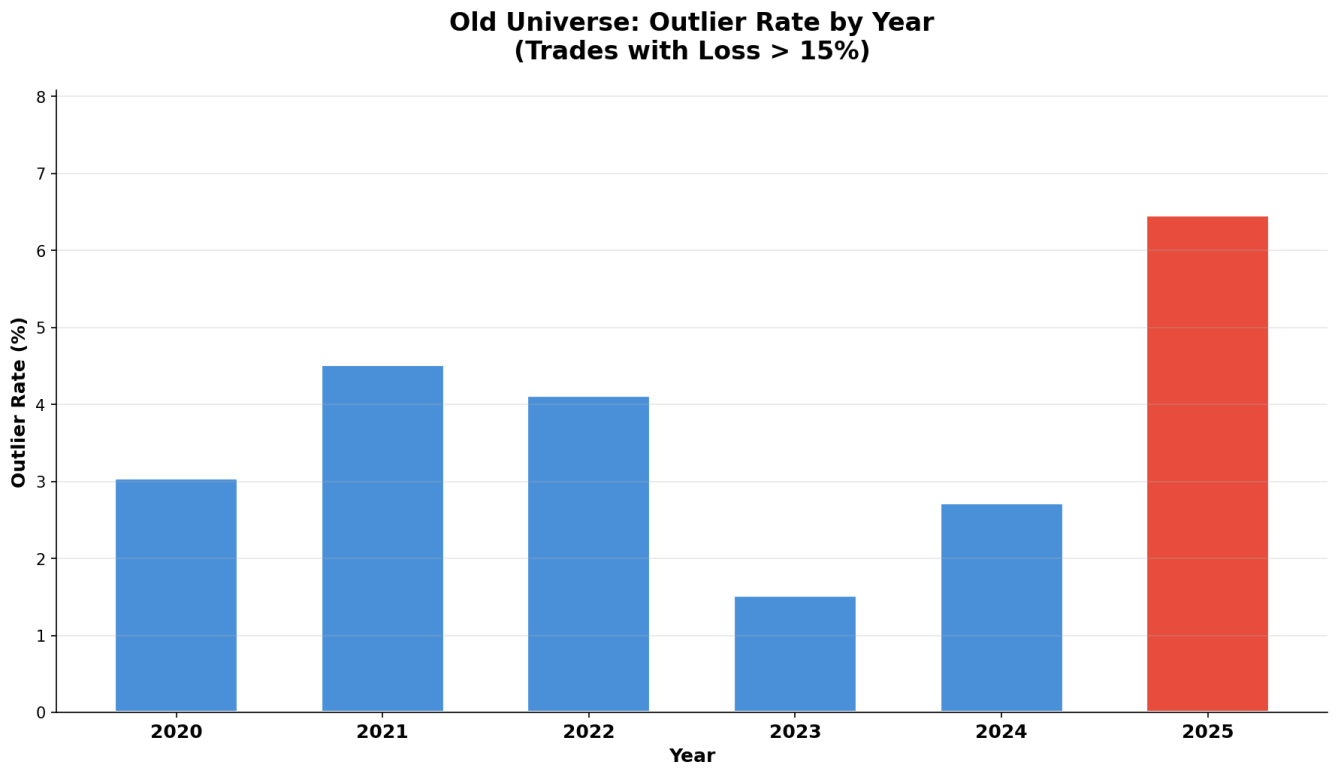
Percentage of trades with losses exceeding 25%. 2020 - 2025
Compared to 2022, the other major altcoin bear market in recent memory, our negative outlier rate was 2.4x higher in 2025. A significant number of these outliers clustered in August and September, deepening the drawdown beyond historical norms.
Context on Negative Outliers
These outliers occur almost exclusively in the smallest coins in our tradable universe. These coins already receive the smallest allocations due to our volatility and quality-based sizing. A 25% negative outlier on such a coin translates to roughly 0.5%–0.8% portfolio loss for our high volatility portfolio, and half that for the low-volatility version.
Statistically, negative outliers cluster in high volatility periods, which are the same periods where we also capture positive outliers of 50%+. The asymmetry typically works in our favor. August–September was unusual in that we experienced the negative outliers without the offsetting positive ones.
The Adjustments
We identified the statistical shift in our data at the start of September and immediately began research. Our goal was to reduce exposure to coins prone to manipulation while preserving exposure to smaller coins with legitimate explosive upside potential. We spent September and October on this research. On November 6th, we deployed the updated portfolio. Below are the adjustments we made.
1. Refined Tradable Universe
The primary change targeted our coin selection. We still trade the top 40–50 coins ranked daily by liquidity parameters. But, we added new metrics focused on coin quality and price manipulation potential.
The coins causing issues shared a common characteristic: susceptibility to price manipulation. Our new filtering mechanism identifies and excludes these coins while maintaining the overall character of our tradable universe.
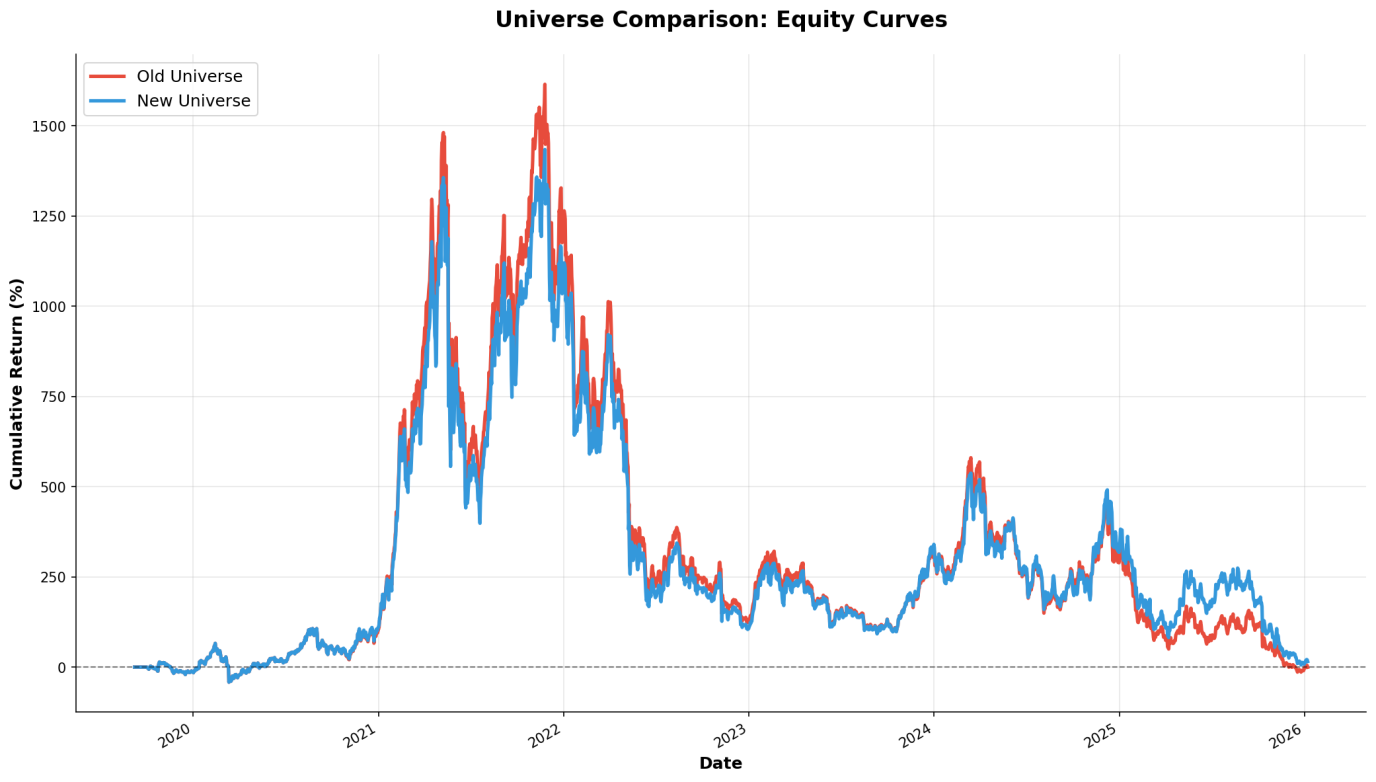
Cumulative returns comparing old and new tradable universe. 2020 - 2025
2. Reduced Negative Outlier Rate
The stricter quality filtering directly reduced negative outliers while maintaining exposure to positive outliers.
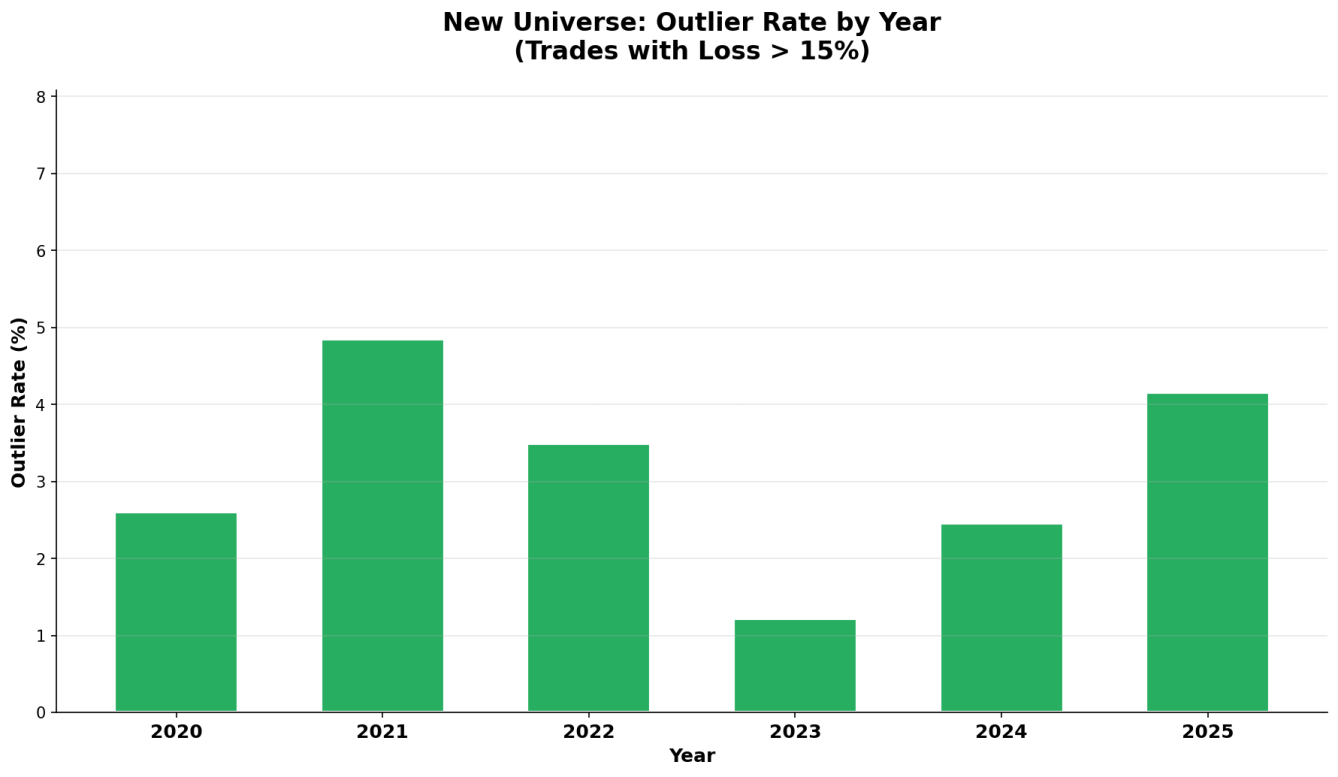
Percentage of trades with losses exceeding 25%, old vs new universe. 2020 - 2025
For additional clarity, here's the 30-day rolling outlier rate comparing old and new universe. The cluster in August–September 2025 is visible in the data. The spike following October 10th did not cause portfolio-level problems. That was a high volatility period where negative outliers on long trades were more than offset by gains on short trades. The portfolio executed several hundred trades during that period.
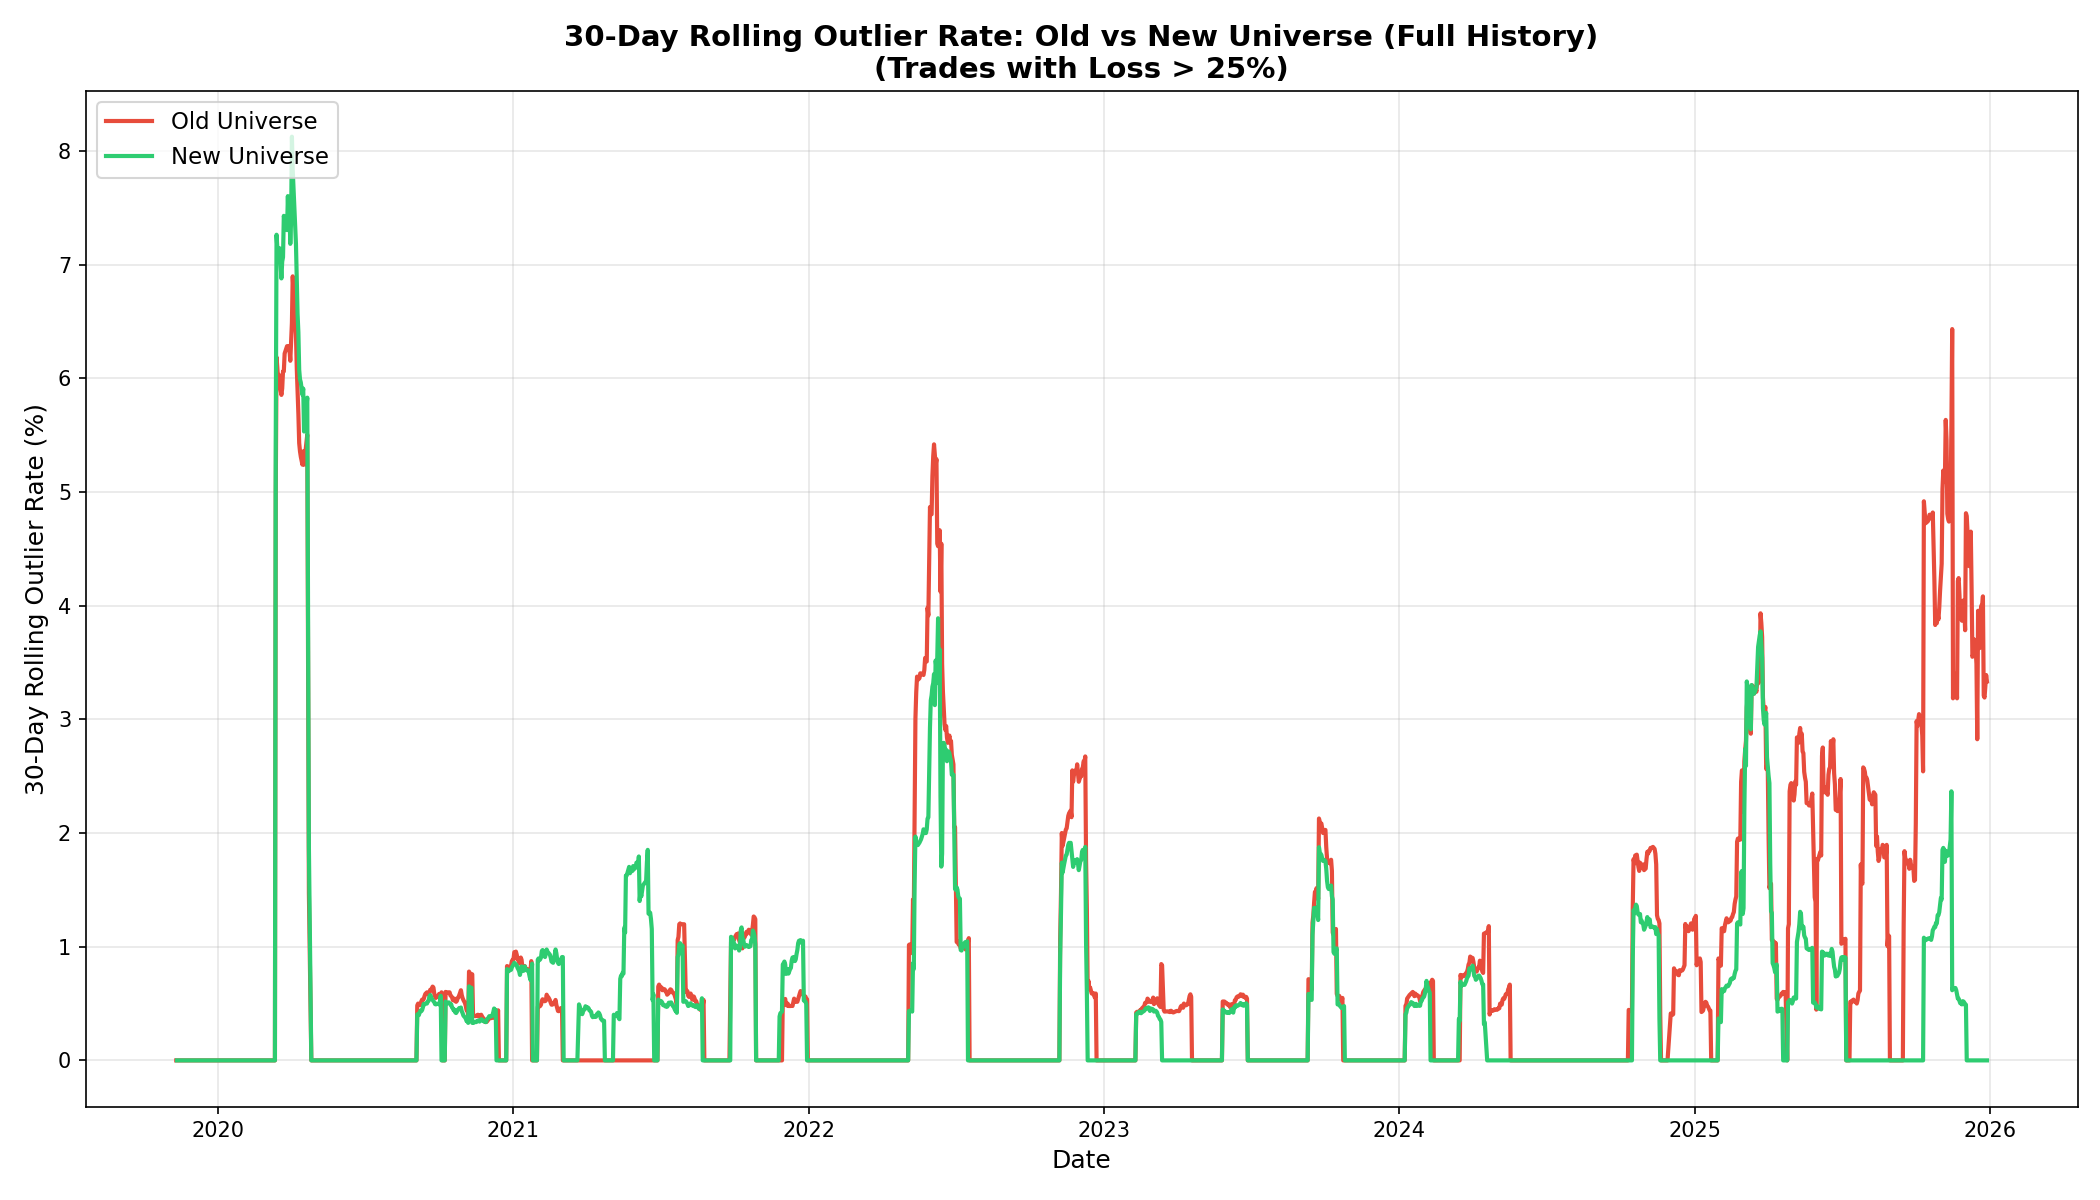
30-day rolling outlier rate, old vs new universe. 2020 - 2025
3. Faster Exit from Negative Outliers
Outliers will always be part of our trading. We developed better mechanisms to reduce their impact through quicker exits in highly volatile edge cases.
4. New Hedging Mechanisms
Our ongoing research always explores low correlation models. In the second half of 2025, we specifically prioritized models with strong hedging characteristics to reduce exposure to various left-tail scenarios.
5. Improved Short-Side Exits
As the crypto market matures, it increasingly shows mean reversion characteristics on the long side, where sharp declines are quickly bought. This pattern is familiar from equity markets. We responded by implementing more aggressive exits from short positions during sharp market corrections. This single change meaningfully improved return stability. Shorting remains essential to our all-weather approach, and our quantitative research in this area continues.
Results Since November 6th
Our goal was to stay exposed to as many small, liquid cryptocurrencies as possible, as these remain the least efficient and offer the highest long-term expectancy, while better managing the associated risks.
Old and New HSHV portfolio performance since November 6th.
The outlier reduction proved particularly effective. After November 6th, the old (no longer traded) universe continued showing elevated negative outlier rates while our current universe showed a significant reduction.
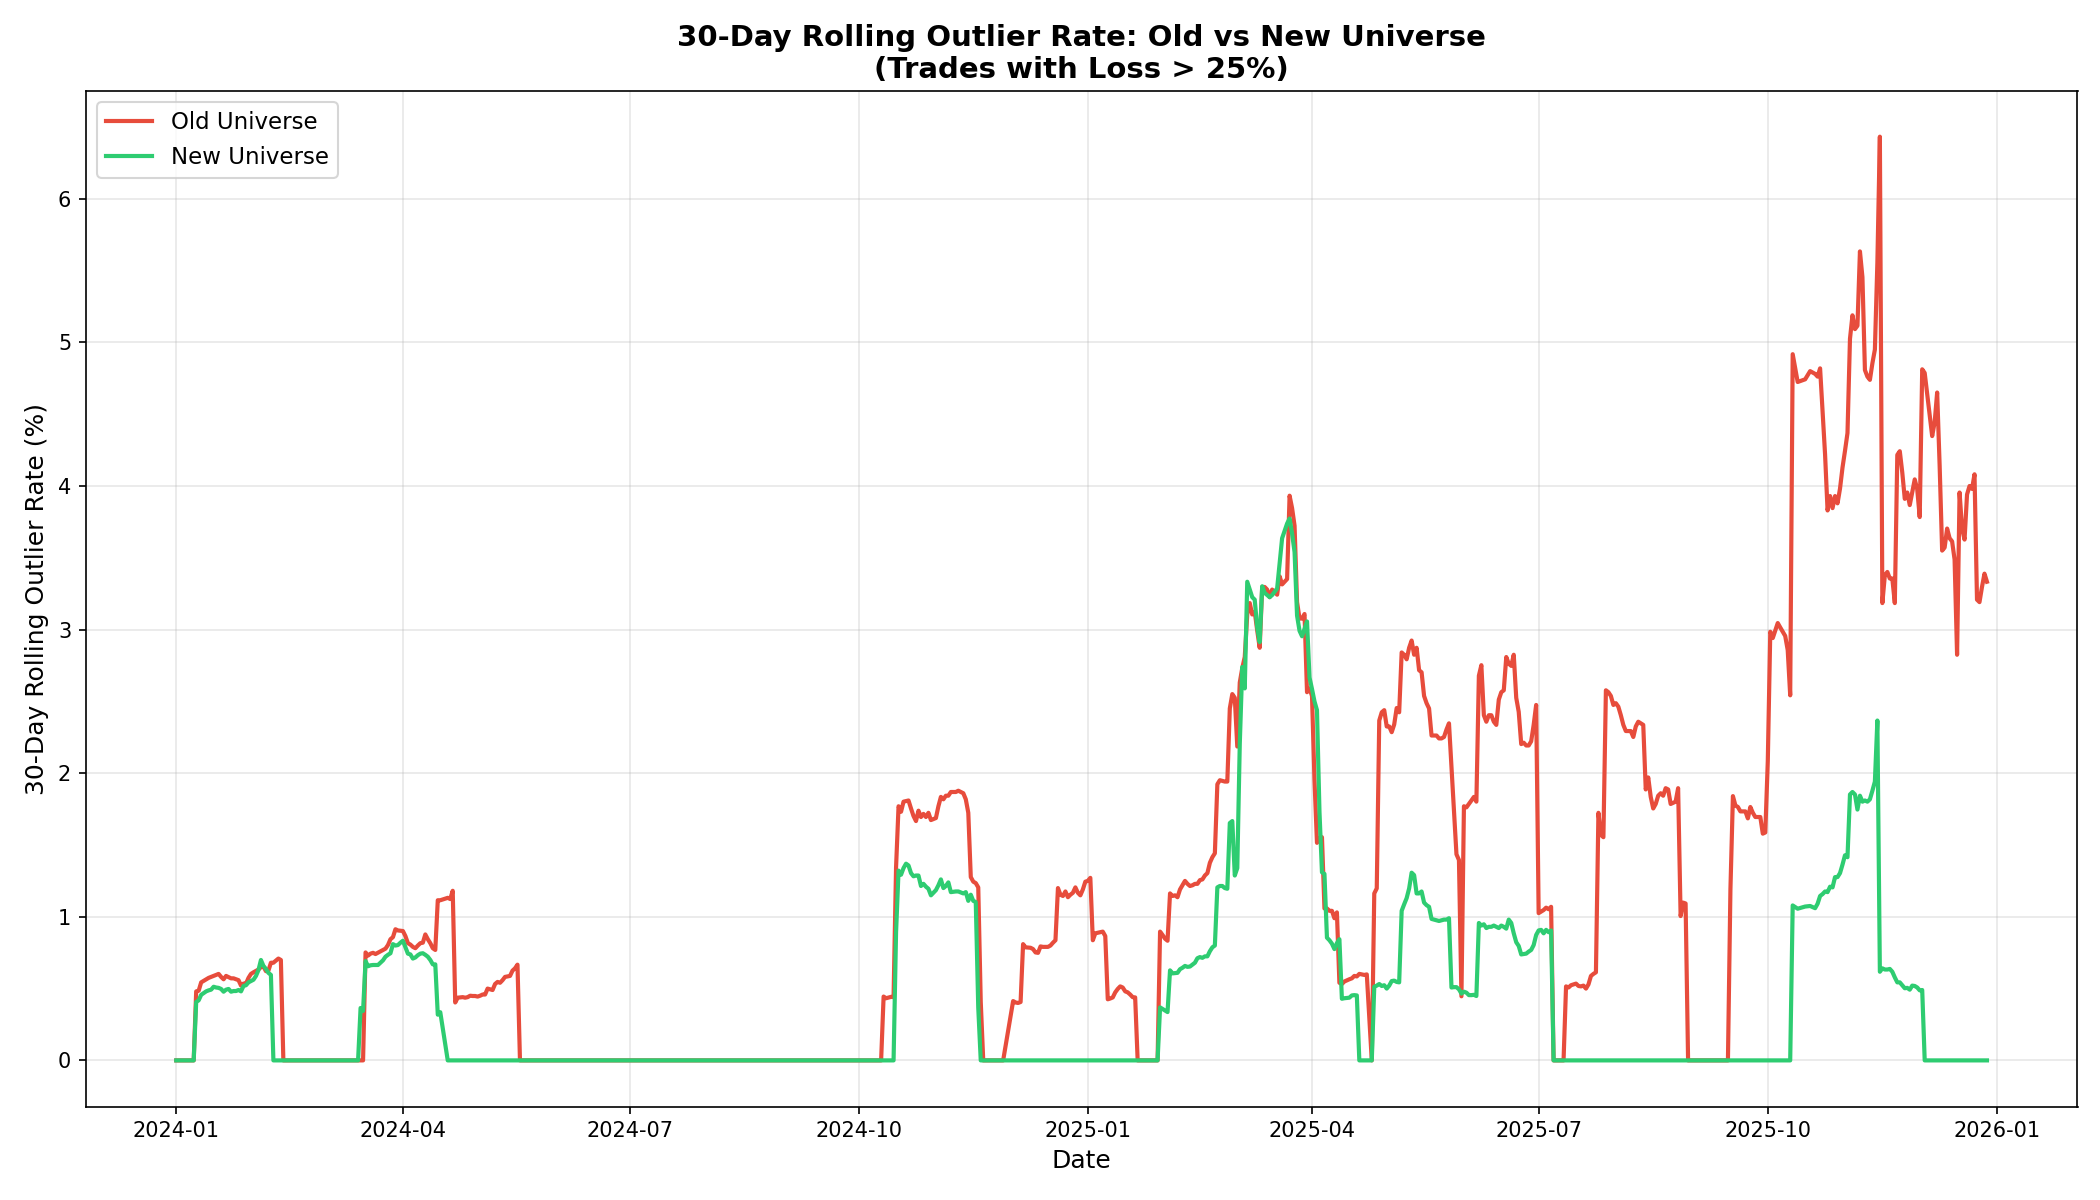
30-day rolling outlier rate, old vs new universe. January 2024 - December 2025
A Note on Volatility
We frequently receive questions about volatility and its impact on our returns. This is a reasonable question, as short-term directional trading is partially correlated with volatility.
Here's the full historical volatility of our Top50 equally weighted index:
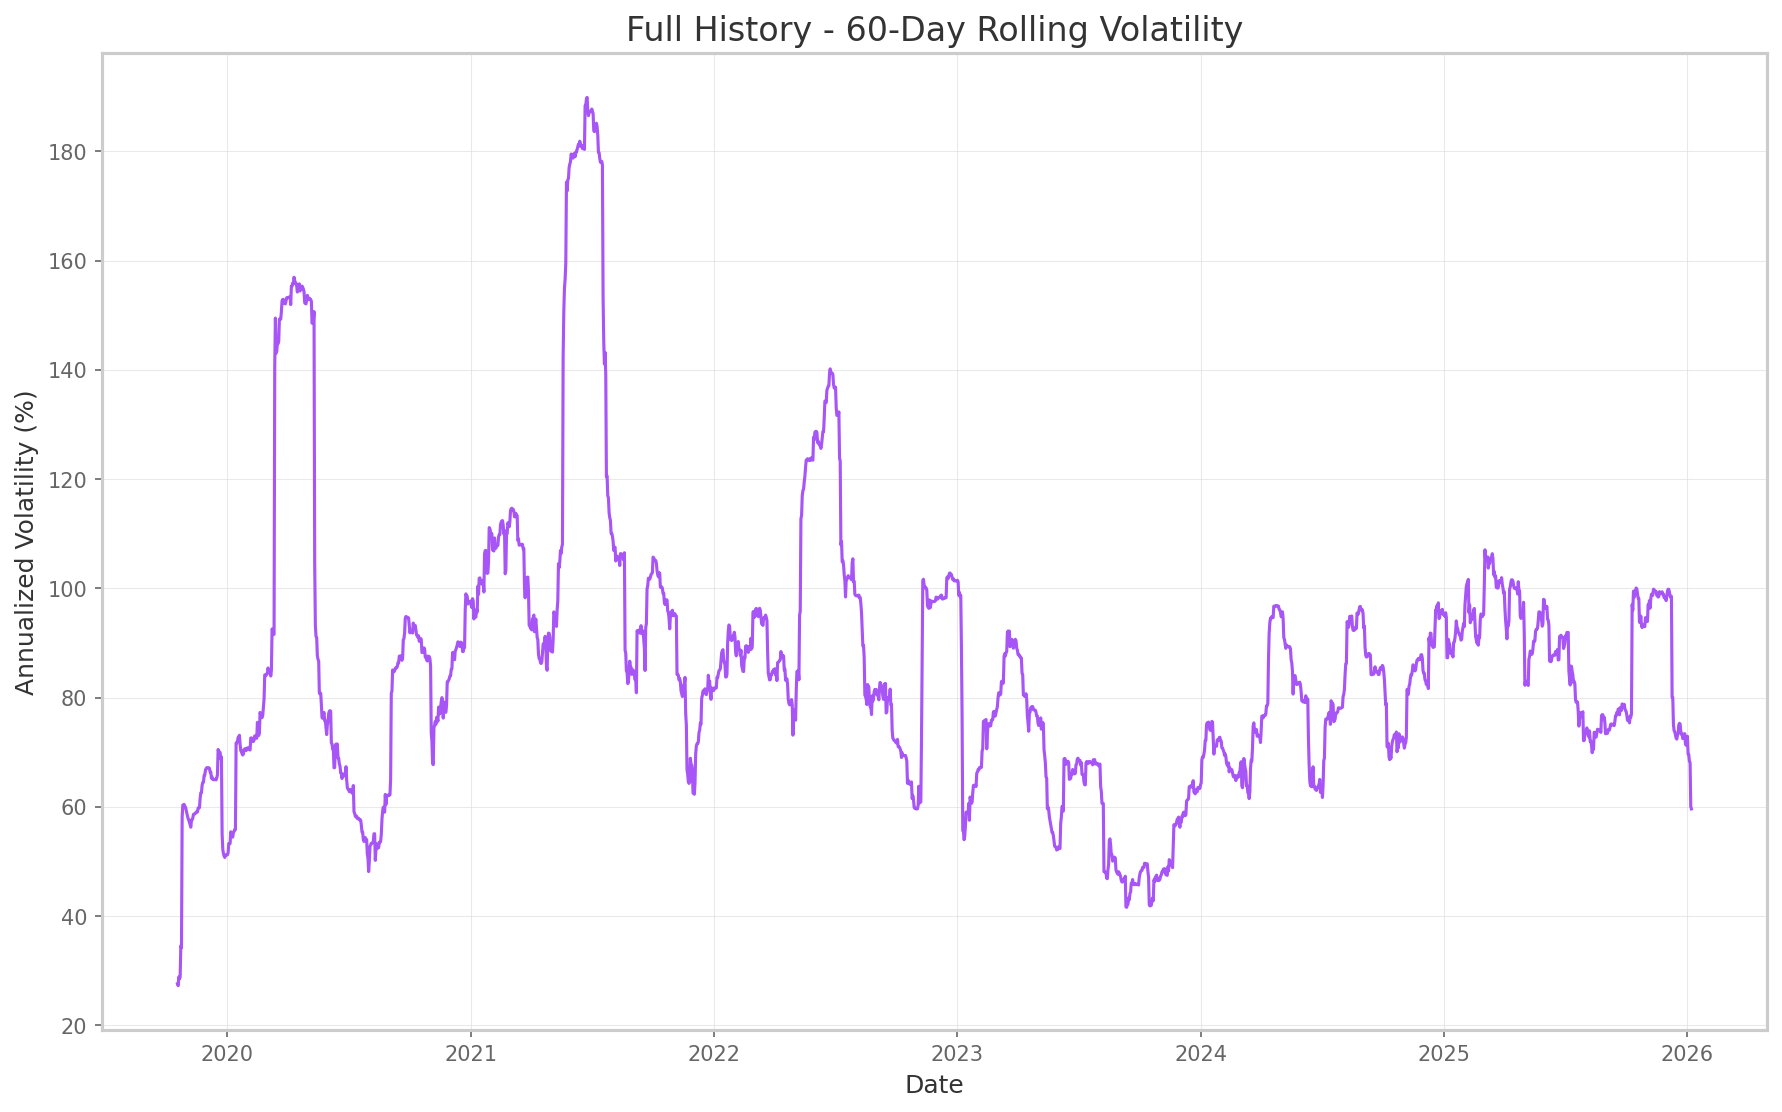
60-Day Rolling Annualized Volatility (%), Top50 Index. 2020 - 2025
The key insight is that while Bitcoin's volatility has declined substantially, the volatility profile of the broader crypto universe has remained essentially unchanged since mid-2022.
Smaller coins remain below the radar of the largest institutional players. This is precisely why we pursue the challenging discipline of diversified portfolio trading across dozens of cryptocurrencies. The potential returns in this universe still significantly exceed what's possible with capital in the hundreds of millions.
The only certain thing in markets is that high volatility periods are followed by low volatility periods, and vice versa. This pattern is as old as financial markets themselves.
Summing Up 2025
In absolute terms, we outperformed both the broad market and Bitcoin.
We had a strong first half of the year. August and September brought not just a drawdown but new insights into changing market dynamics. These insights were then implemented promptly.
The portfolio udpates have reduced downside volatility while maintaining our exposure to the broad cryptocurrency market through a highly diversified portfolio of directional strategies.
To your continued success,
The Robuxio Team