Traders typically focus on potential profits, but a discerning few delve deeper into strategy metrics, with even fewer confronting the reality of drawdowns.
Few realize that they will spend significantly longer with their investment in a drawdown than at new equity highs.
Most trading strategies are in some sort of drawdown phase around 90% of their time or more. That’s why it’s important to pay attention to them and understand when they occur and what the reason is.
And that’s exactly the topic I want to address in this blog post at what stages of the market to expect drawdowns depending on the strategies you trade.
But first, a few definitions.
What is a drawdown
In the simplest terms, a drawdown is the period between the previous highest point of the equity curve and the newly formed highest point of the equity curve.
This definition implies that you are basically in a drawdown any time your trading account is not making new highs.
How we measure drawdown
There are 2 basic metrics by which drawdown can be measured – using length (in days) and depth (in percentage).
Percentage depth of drawdown
When someone researches drawdowns, they usually address their depth. This is given as a % of the highest peak reached in the account.
The length of the drawdown
Many traders neglect this metric, yet undervaluing it is a mistake. Especially because of the psychology of trading. After all, if you see historical trading results and periods when the equity curve goes sideways, might seem uneventful. However, a phase where the account moves sideways within a drawdown, fluctuating between deeper and shallower levels, poses a real psychological challenge. And you need to prepare for it.
And with some trading approaches, you need to be prepared for drawdowns that can last for years…
Why do you need to understand drawdowns?
1. Psychological reason
Drawdowns are a natural part of trading. The sooner you accept this fact, the better for you. There will always be more fun phases when your account grows to a new high. But this will happen in no more than 10% of all trading time.
2. Risk management reason
If you understand when drawdowns occur in relation to the strategy you are trading, you can quickly see if the drawdown you are currently in is within the norm. A drawdown caused by a phase of the market that is unfavorable for that strategy is perfectly normal..
However, if a deeper drawdown is forming in a period that is favourable for the strategy, it is possible that your strategy is no longer working.
Recognizing a drawdown as a normal phase versus a signal of strategy failure is key.
When do drawdowns occur?
Simply put, in periods that are not favorable for the system being traded. However, this cannot be completely generalized and needs to be looked at in terms of two basic trading approaches. For a deeper exploration of trading approaches, visit: Systematic Trading III: Trading Approaches.
Trend Following Strategies and its Drawdowns
Strategies that attempt to trade long-term trends. They try to follow these trends for as long as possible.
When do drawdowns occur in Trend Following?
1. Adverse Market Movements Against Open Positions
Why This Leads to Drawdowns:
The principle of trend strategies is to hold a position as long as possible, to make the most of the trend. In order to make the most of this, you need to give the market enough space. This is because corrections within a trend are perfectly normal and you don’t want to get out on every minor one. The downside is that you often give back a large portion of your open profits..
2. When there is no trend in the market.
Why This Leads to Drawdowns:
Because it misses the primary reason why trend strategies make money – long-term movement in one direction. It is impossible to expect profits during such a period. At the same time, it is not possible to filter trend entries too much, as this can cause you to miss the first phase of the trend, which is often the strongest.
Characteristics of trend strategies drawdowns
Trend strategies drawdowns are usually deeper and last for a longer period of time. The main reason for this is that the markets do not trend most of the time. This creates a series of losing trades that build up over time.
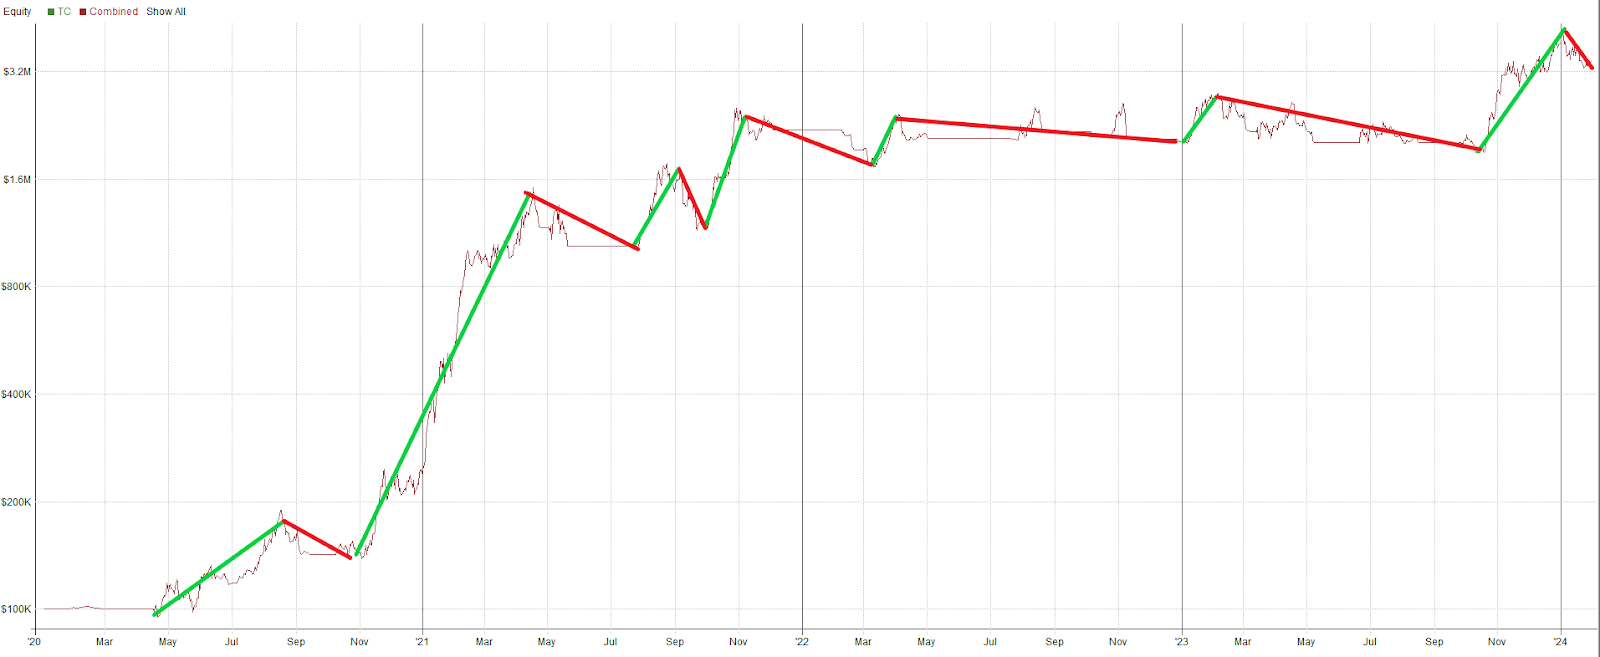
In the picture below there is a Trend Catcher Long – a trend strategy that trades only in the direction of the long trend. The green line shows a period when the market was in a stable trend and the strategy was profitable. In all other periods, the strategy was in bigger or smaller drawdowns. Perfectly expected behavior.
Mean Reversion Strategies and its drawdowns
Mean Reversion Strategies try to trade against strong market reactions. These are short-term “countertrend” strategies.
When Do Drawdowns Occur in Mean Reversion Strategies?
1. During Strong Trends or Extended Market Movements
Why Drawdowns Happen:
The core idea behind Mean Reversion is the expectation for prices to revert to their average after significant deviations. However, in very strong moves, this mean reversion behavior of price does not occur.
Characteristics of Drawdowns of mean reversion strategies
Mean Reversion strategy drawdowns are generally shallower and shorter, as these strategies do not rely on large market movements to generate profits. However, you should expect the occasional sharp drawdown when the market shoots up hard against open positions.
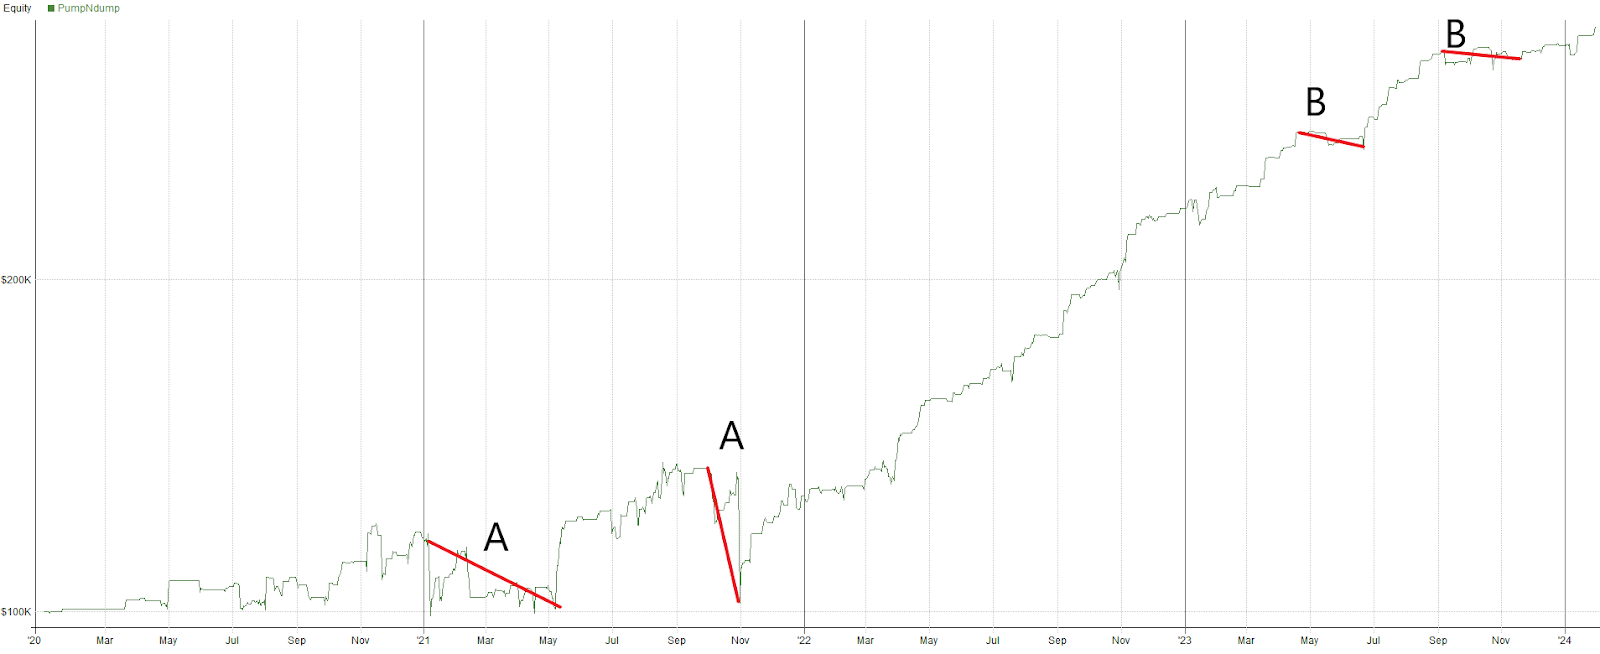
Pictured below is Pump and Dump – a strategy that trades mean reversion to the short side. At first look, you can see a more stable equity curve – but with significantly lower absolute returns. Most drawdowns are shallower and occur during periods of low volatility – see points B. Occasionally, rougher steeper drawdowns arise in very strong trends like in 2021 – points A.
Portfolio approach and drawdowns
Trading a broad portfolio of uncorrelated strategies like we do at Robuxio is the solution to reducing the depth of drawdowns and shortening their length. Thanks to the previous blog post, you already know why – each trading approach creates drawdowns (and profits) at a different point in time.
However, this does not mean that we get rid of drawdowns completely.
When do drawdowns occur in portfolio trading?
In portfolio trading, the dynamics that lead to drawdowns differ significantly from those in individual strategy trading. There are 2 main causes of deeper drawdowns in portfolio trading:
1. A rapid change in the regimes, or market phase
What are the basic regime changes?
- From long trend to short trend
- From short trend to long trend
- From trending market to sideways market
Why does a drawdown occur?
Most strategies trade with some sort of filter that turns the strategy off or on depending on the market regime. If the regime change is slow, the strategies gradually adapt to the new regime. If it is a regime they should not trade in, they automatically turn off.
However, if the change is rapid, the switching off will occur with some delay. This allows more strategies to get into a market that is not profitable for them and build up losses. These losses across a larger number of strategies lead to deeper drawdowns.
2. Strong corrections into an established trend
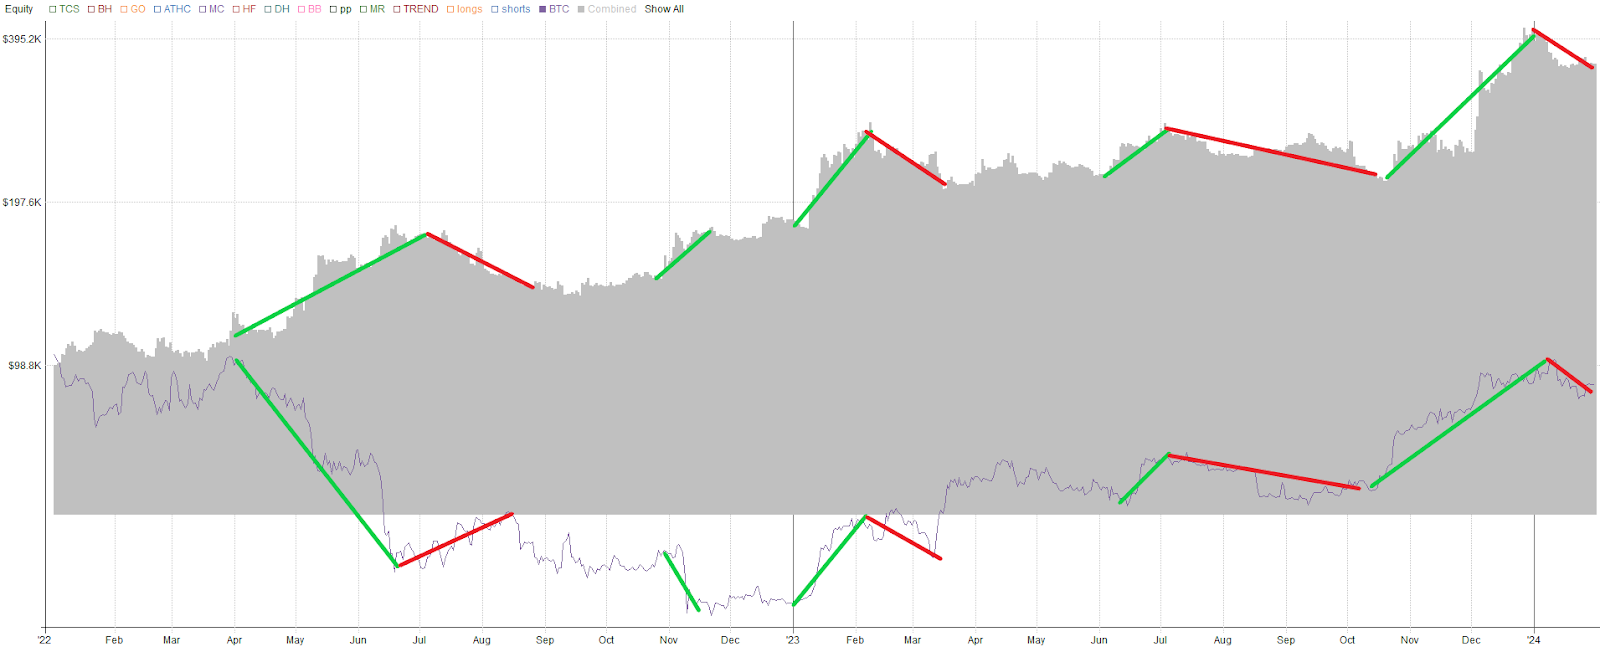
An example is the image below where you can see the High Risk Portfolio from early 2022 (grey) and the Bitcoin price (purple). Simply put, Bitcoin sets the trends in the cryptocurrency market.
The green line shows an established trend – both long and short – and the red line shows a deeper correction into that trend. As you can see, in the case of deeper corrections, there are almost always drawdowns on the equity curve as well.
When do drawdowns happen?
At times when a strong trend is established in the market, most strategies that profit from trends get into maximum positions. When a correction occurs, there comes a period when some of the profits are given back to the market. The faster the correction comes, the deeper the drawdowns usually are. Since, again, it takes time for strategies to adapt to the new market phase.
If you think about it, these two cases above are essentially identical. Since you never know in advance if a larger correction will bring a change in the regime. We always see this information on the chart in hindsight. Never forward.
Drawdowns – Investing vs. trading
It is important to note that there is a big difference between drawdowns in investing and trading. In investing, a drawdown occurs whenever the asset we are holding declines.
In portfolio trading, however, this is not the case. Here, drawdowns occur when the regime changes.
Current example – Robuxio portfolios were at their highs on 31 December 2023. They have been in drawdown since then. What is the reason? Probably a strong correction. Unless it develops into a regime change. But if the market continues to fall, strategies that trade on the short side would take more and more initiative and start to deliver profits. The equity curve would begin to rise again. Similar to when a correction remains just a correction and the long trend returns to the market.
Novice traders don’t realize this connection as much, and when the market falls and a drawdown occurs, they start creating scenarios in their heads that if the market falls another X%, the drawdown will also increase by another X%. This is not the case. A new regime is established, profits return and the portfolio stabilizes.
Embracing Drawdowns in Trading
Drawdowns are a natural part of trading. You will probably never like them. But you can get used to them. Think about them, understand them and if you are a trader trading your own solution, be aware of when drawdowns are likely to occur and when they are not. This awareness is key to moving through drawdowns, achieve new equity highs and letting your trading account grow over the long term.