Now it’s time to combine everything we’ve learned so far in this series. We’ve learned how to turn ideas into rule-based strategies and how to test those strategies correctly. Perhaps one of the most important blogs was about understanding the risk of ruin and how we can avoid it by using proper risk management. Once you understand that, you will think about trading completely differently. This blog will hopefully be a significant “AHA” moment, helping you understand the power and need for a portfolio of uncorrelated strategies to avoid most trading mistakes.
As we know, a single strategy can’t be profitable all the time, but only during the market conditions for which it’s designed. Accepting this fact already puts you ahead of 90% of all retail traders!
So, knowing this, it’s clear that we need multiple strategies that work in different market conditions. It wouldn’t make sense to create long-only trend following strategies and expect to be profitable when the markets aren’t trending to the long side.
It’s easier when I show you. So, let’s construct a trading portfolio like we do at Robuxio.
The cryptocurrency market, known for its volatile and trend-driven nature, is perfect for a trend-following strategy.
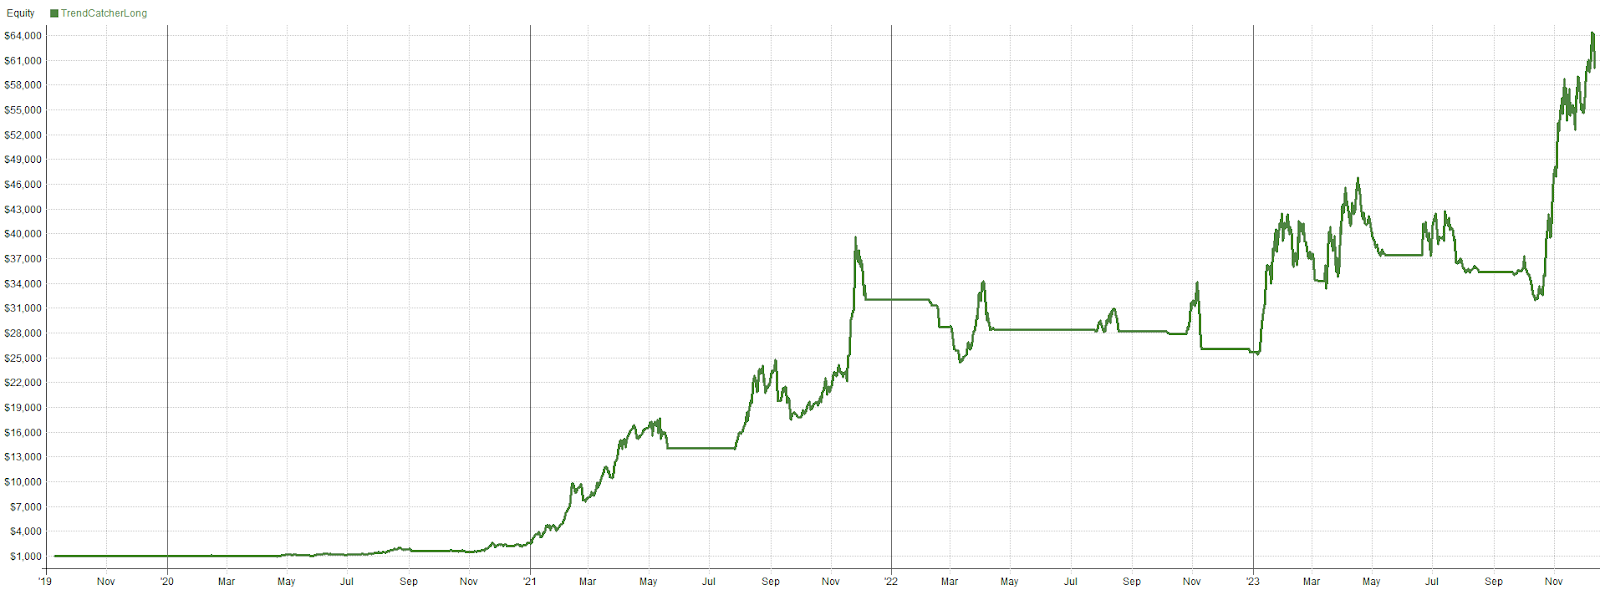
So, let’s start with our TrendCatcher Long. If you want the exact rules: click here.
Results:
Overall Profit: 5,806%
Historical Drawdown: 38%
Winning trades: 30%
The strategy does a pretty good job of making money when the market is in an uptrend, and in all other market conditions, it’s flat or losing a bit of money — exactly what we want to see.
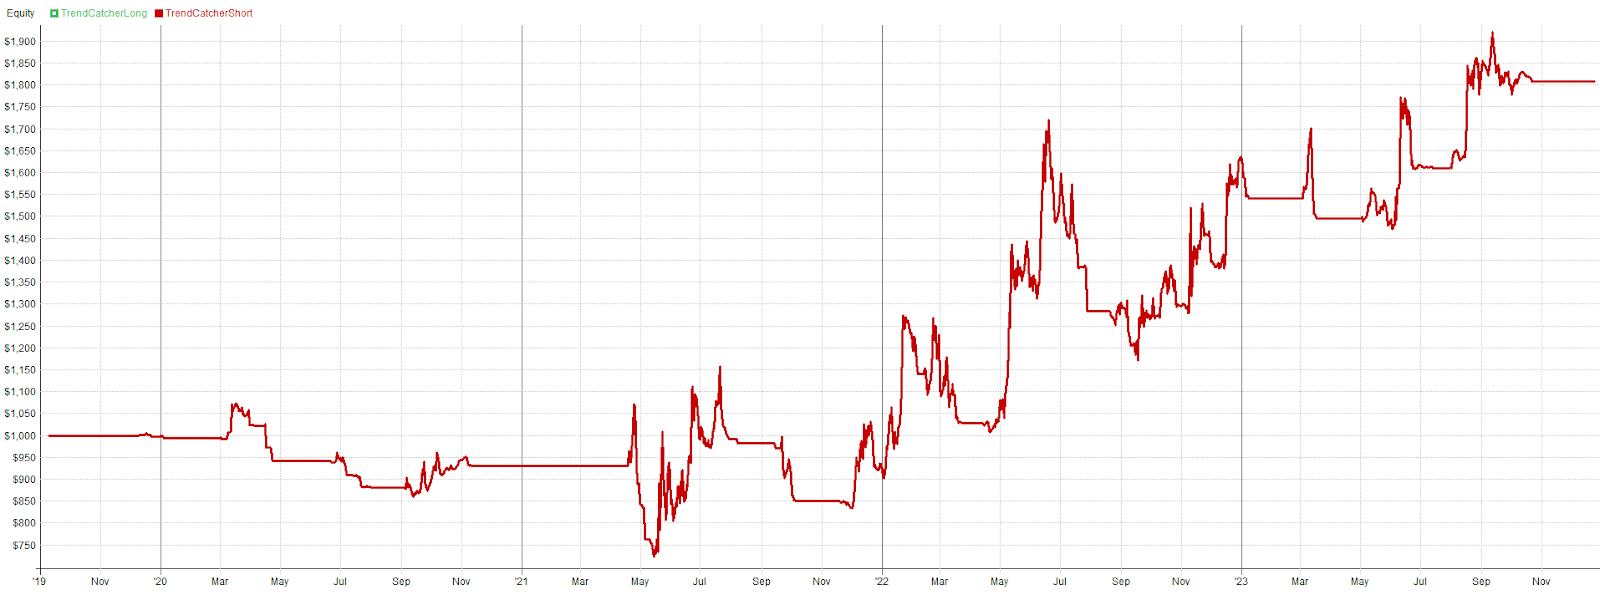
What we could do now is also trade this strategy on the short side, with the results just in reverse, so we also make money in downtrends.
Results:
Overall Profit: 81%
Historical Drawdown: 33%
Winning trades: 36%
Obviously, not as profitable as the long side, as coins can only go a maximum of -100%, but the upside has no limit.
Portfolio
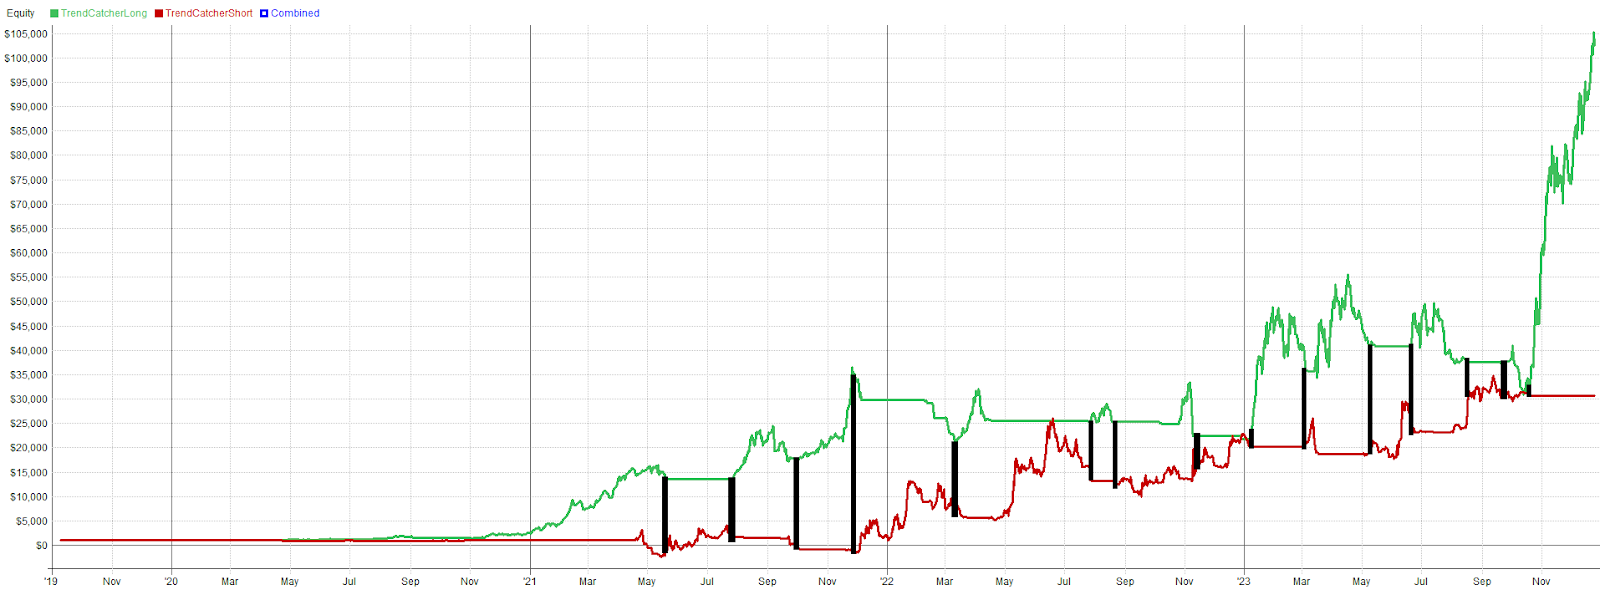
Imagine you had $1,000 to trade with and split it evenly between two strategies, here’s how it would work out:
- For the long Trend Catcher strategy, your $500 would have turned into $29,800.
- For the short version, the other $500 would have turned into $900.
So, in total, you would now have $30,700.
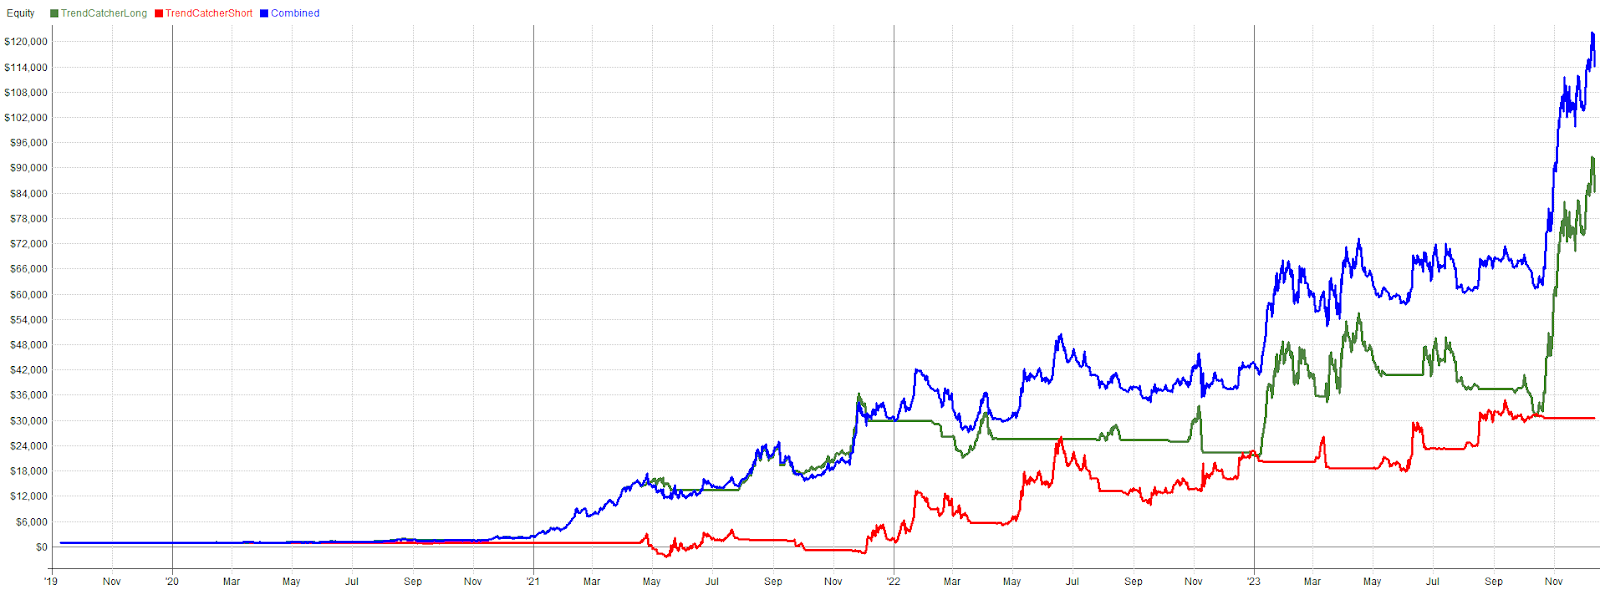
However, in a portfolio, you would run those 2 strategies with the same capital. We know that the long and short entries are complementary. Thanks to the regime filter, we always have only long entries or short entries. We can therefore use the same trading capital.
Results:
Overall Profit: 12,000%
Historical Drawdown: 37%
Winning trades: 33.5%
Pretty crazy, right? Your performance increases significantly if you run it on the same account — you get $113,216, almost four times more compared to running it separately!
This is because those strategies have a low correlation. Put simply, if strategies generate profits and losses at the same moment, their correlation coefficient is high. If one strategy generates profits at the exact moment the other is in a drawdown, the correlation is negative, meaning the strategies are negatively correlated. If there is no connection between the strategies, they are uncorrelated, and the correlation coefficient is neutral. The closer the correlation is to neutral or below, the better.
Let’s look at the correlations between Trend Catcher Short and Long:
So as you can see, the returns are slightly negatively correlated, meaning that when the long strategy is making money, we are either flat or losing money and vice versa. That is exactly what we want, and the drawdown correlation is also low.
So imagine that TrendCatcher Long is in a drawdown because the market is in a bear market. But instead of starting the new bullish trend with a lower account balance, we’re likely to start with a higher account balance because TrendCatcher Short made money. So there’s no need to first make up for the drawdown we suffered; we can start directly with a higher balance, compounding our account.
But trend-following strategies are also the most volatile. This is expected, as we stay in the market for a long time, and the coins that perform well are mostly associated with high volatility. We also have a low win rate with many small losses. This is by design, as we need to give the market room to grow. If we are too strict or try to “fit” the parameters so you get in at every bottom and out at the top, over time, you will just bleed your account to zero because of the over optimized strategy.
It’s essential to take every trade in the strategy. Missing out, especially because of unnecessary filters, could mean losing the biggest wins of the year.
Therefore, it’s better to make money with volatility in your equity curve than to slowly lose all your money with low volatility. There are better ways to reduce this volatility. We do this at Robuxio by not only using the Trend Catcher strategies but also implementing many other trend strategies and mean reversion strategies that are uncorrelated with them. I will present Robuxio’s new portfolio, set to launch from February 2024.
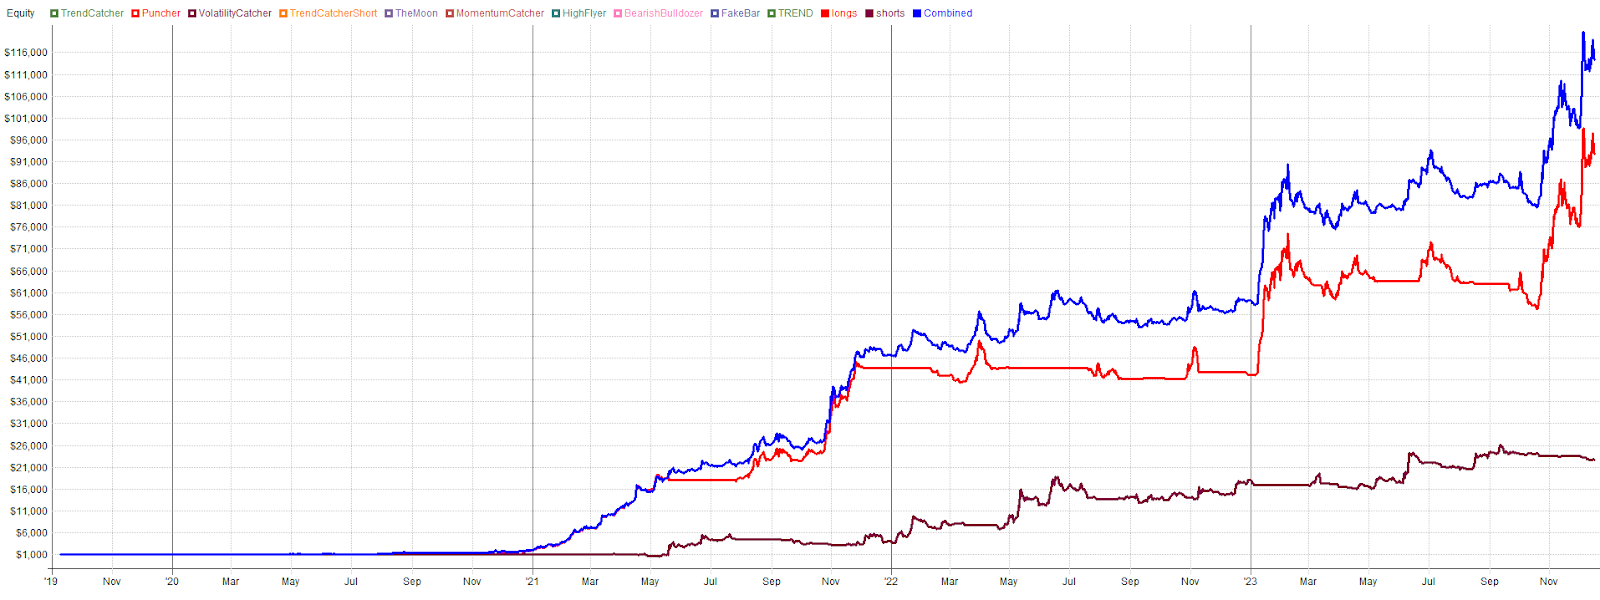
Let’s start by looking at all our Trend Strategies. This includes our Trend Following and Breakout strategies for both the long and short sides. To be precise, 6 strategies to the long side and 3 to the short side.
You can clearly see that the equity curve is quite similar to the one of Trend Catcher Long and Short. That’s pretty normal because it’s still the same market; we can only make money when the market trends. If the market is flat, we can’t make money! It’s very crucial to ensure your strategies only make money when they are intended to. Otherwise, it’s highly likely you’ll just overfit rubbish.
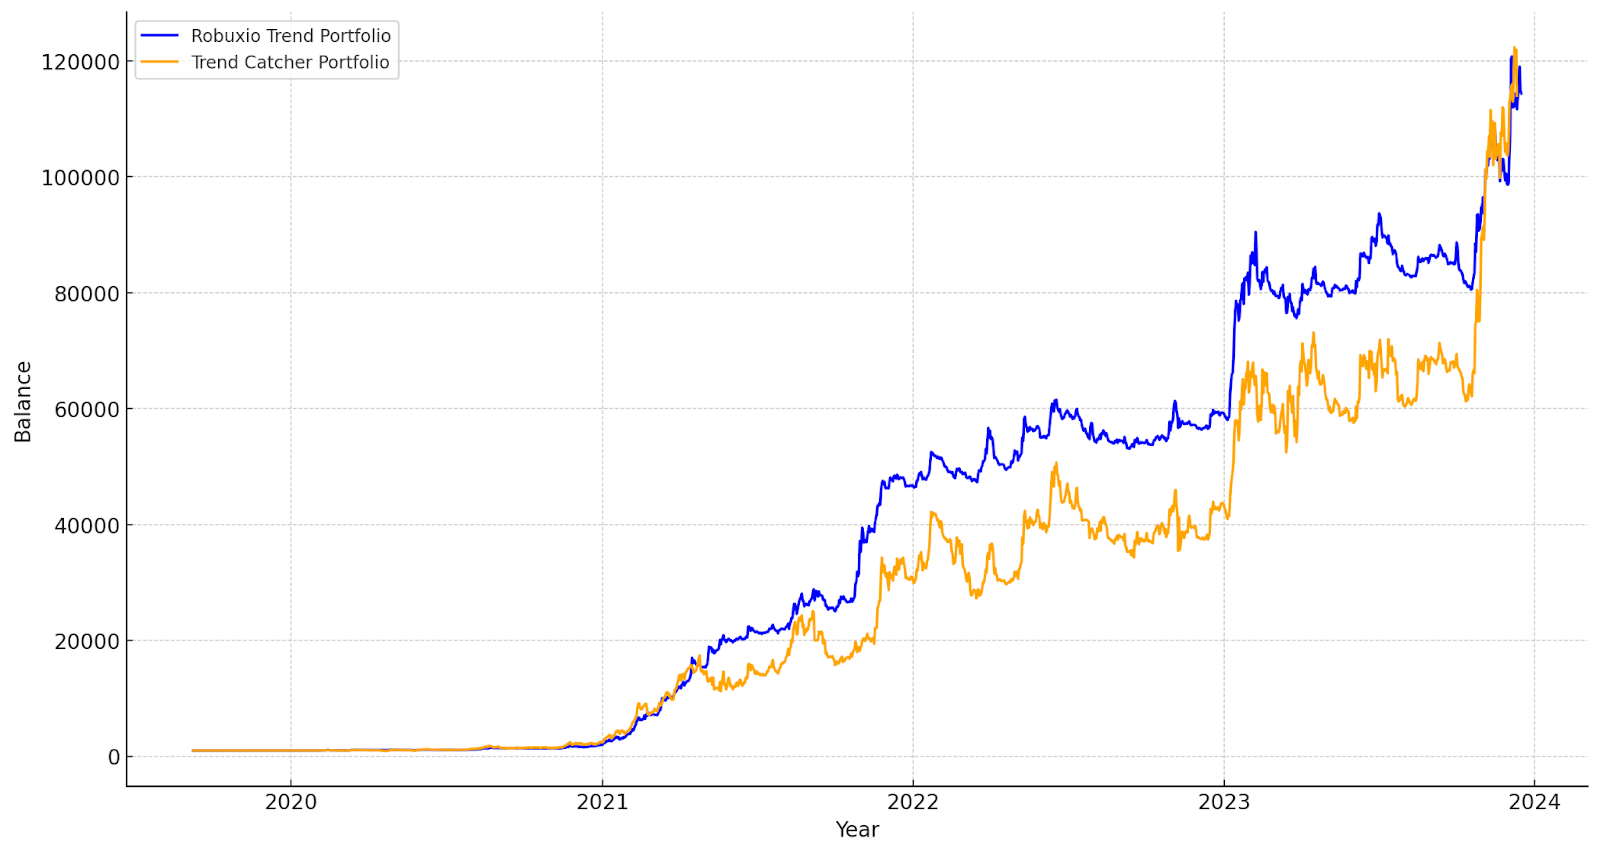
If you look at this chart of the TrendCatcher Portfolio and compare it with our Robuxio Trend Portfolio, take a close look and you will see that, even though they made the same return, the curve of the Robuxio Trend Portfolio is way smoother. The historical maximum drawdown is now at half of what it was before with the TrendCatcher Portfolio.
As we can see, our approach is becoming more advanced. Despite all being trend strategies, we’ve managed to keep the correlations between them low, which allows us to reduce volatility in the account and use less capital to achieve the same profit.
A big metric that proves this is the average usage of our capital: 33% in our Robuxio trend portfolio versus 73% with the Trend Catcher portfolio. This has many advantages. It means that we don’t need to overexpose ourselves to the market on single coins but can diversify over many more. So, the risk of losing lots of capital due to a collapse like what happened to Luna is heavily reduced. We also don’t have so much risk that if one strategy fails, it will ruin our account. On the contrary. If you trade 10 or more strategies and one stops making money, you may not even notice it in your account.
Even if you try avoiding overfitting your strategies as much as you want, sometimes it will happen. When you trade a broad portfolio, this will affect you way less. Also, this simple form of trend following might not be so profitable anymore once the market matures more, so you should definitely not place all your chips on one single strategy!
So now that we know that our capital is available for other strategies and also know how crucial it is to add strategies for risk management, we can add strategies that trade when our current ones are not in the market or when our current ones have a hard time as a hedge.
Mean Reversion strategies are the perfect strategies to do exactly that. If you don’t know what those strategies are, read our blog. You can also call them counter-trend strategies. This tells us enough that they would be perfectly complementary to our trend strategies as they trade against the current trend.
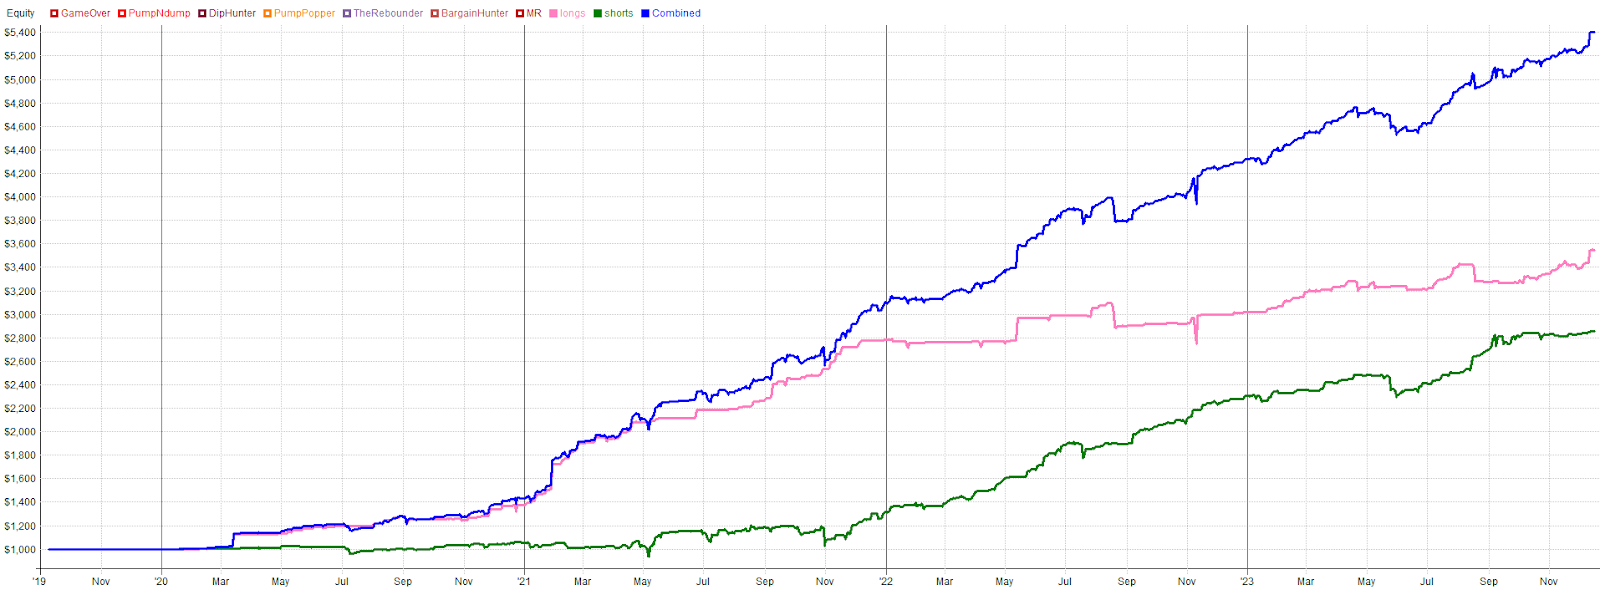
We have again a basket of 3 long and 3 short mean reversion strategies, each performing in different market conditions. This allows the sub-portfolio to create profits in almost all market environments. The good thing about this is that with mean reversion you can create a very stable equity curve, as we are only very short term in the market. But as you can see on the chart below by far not as profitable as trend strategies.
Results:
Overall Profit: 440%
Historical Drawdown: 10%
Winning trades: 65%
The good thing you can see here is that the correlation is very low. Even better, the drawdown correlates negatively. So, this is the dream scenario: when Strategy A is losing money, Strategy B is making money.
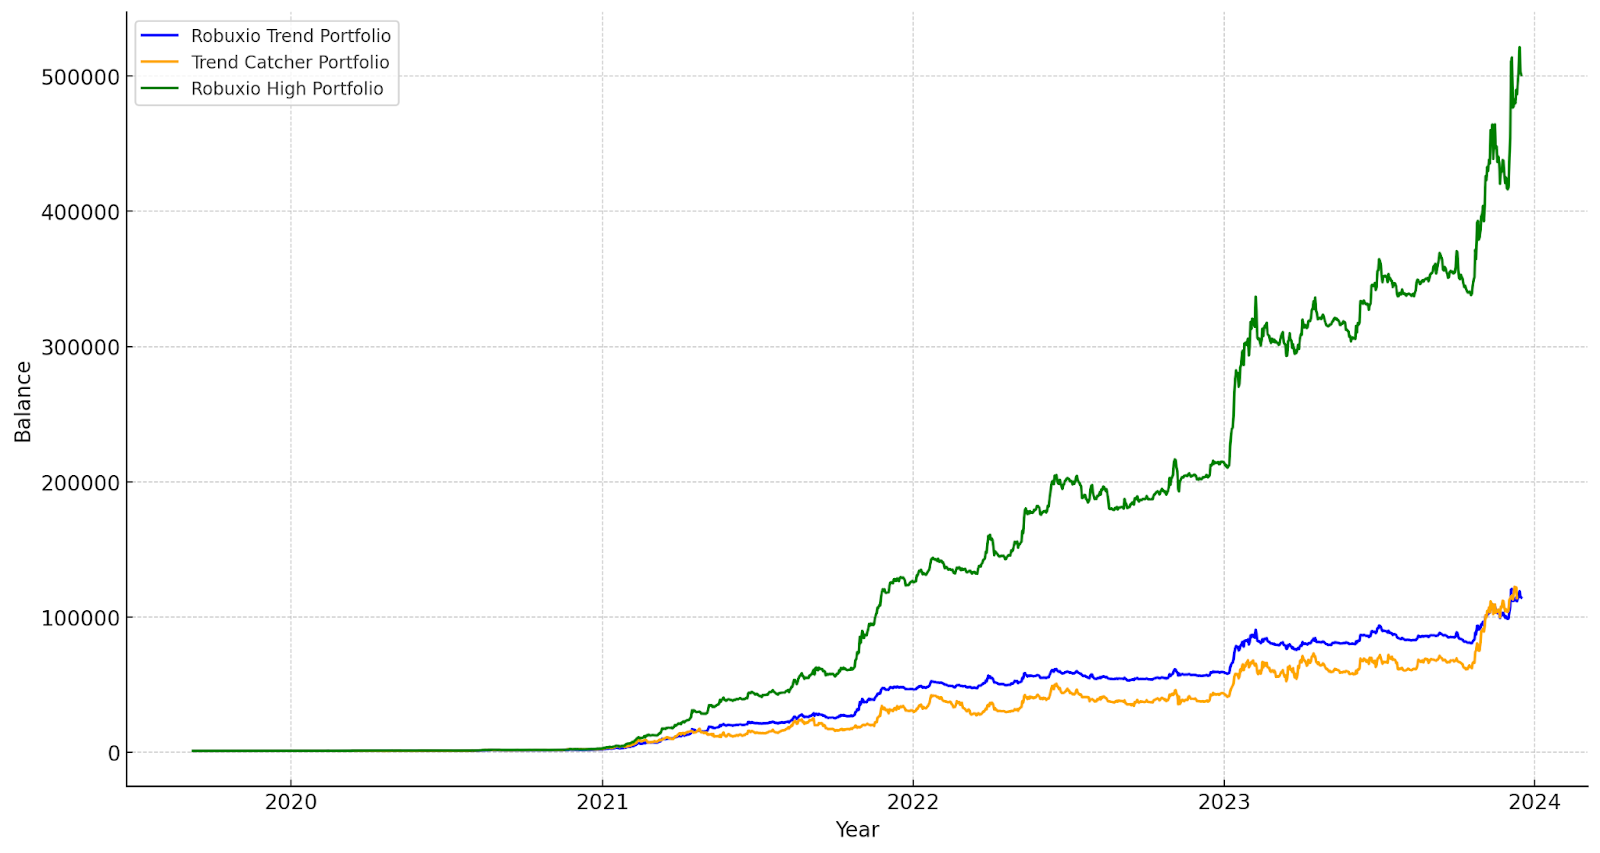
Now onto the real magic of portfolio trading – let’s trade the Trend and Mean Reversion strategies as one portfolio!
Results:
Overall Profit: 49,000%
Historical Drawdown: 15%
Winning trades: 53%
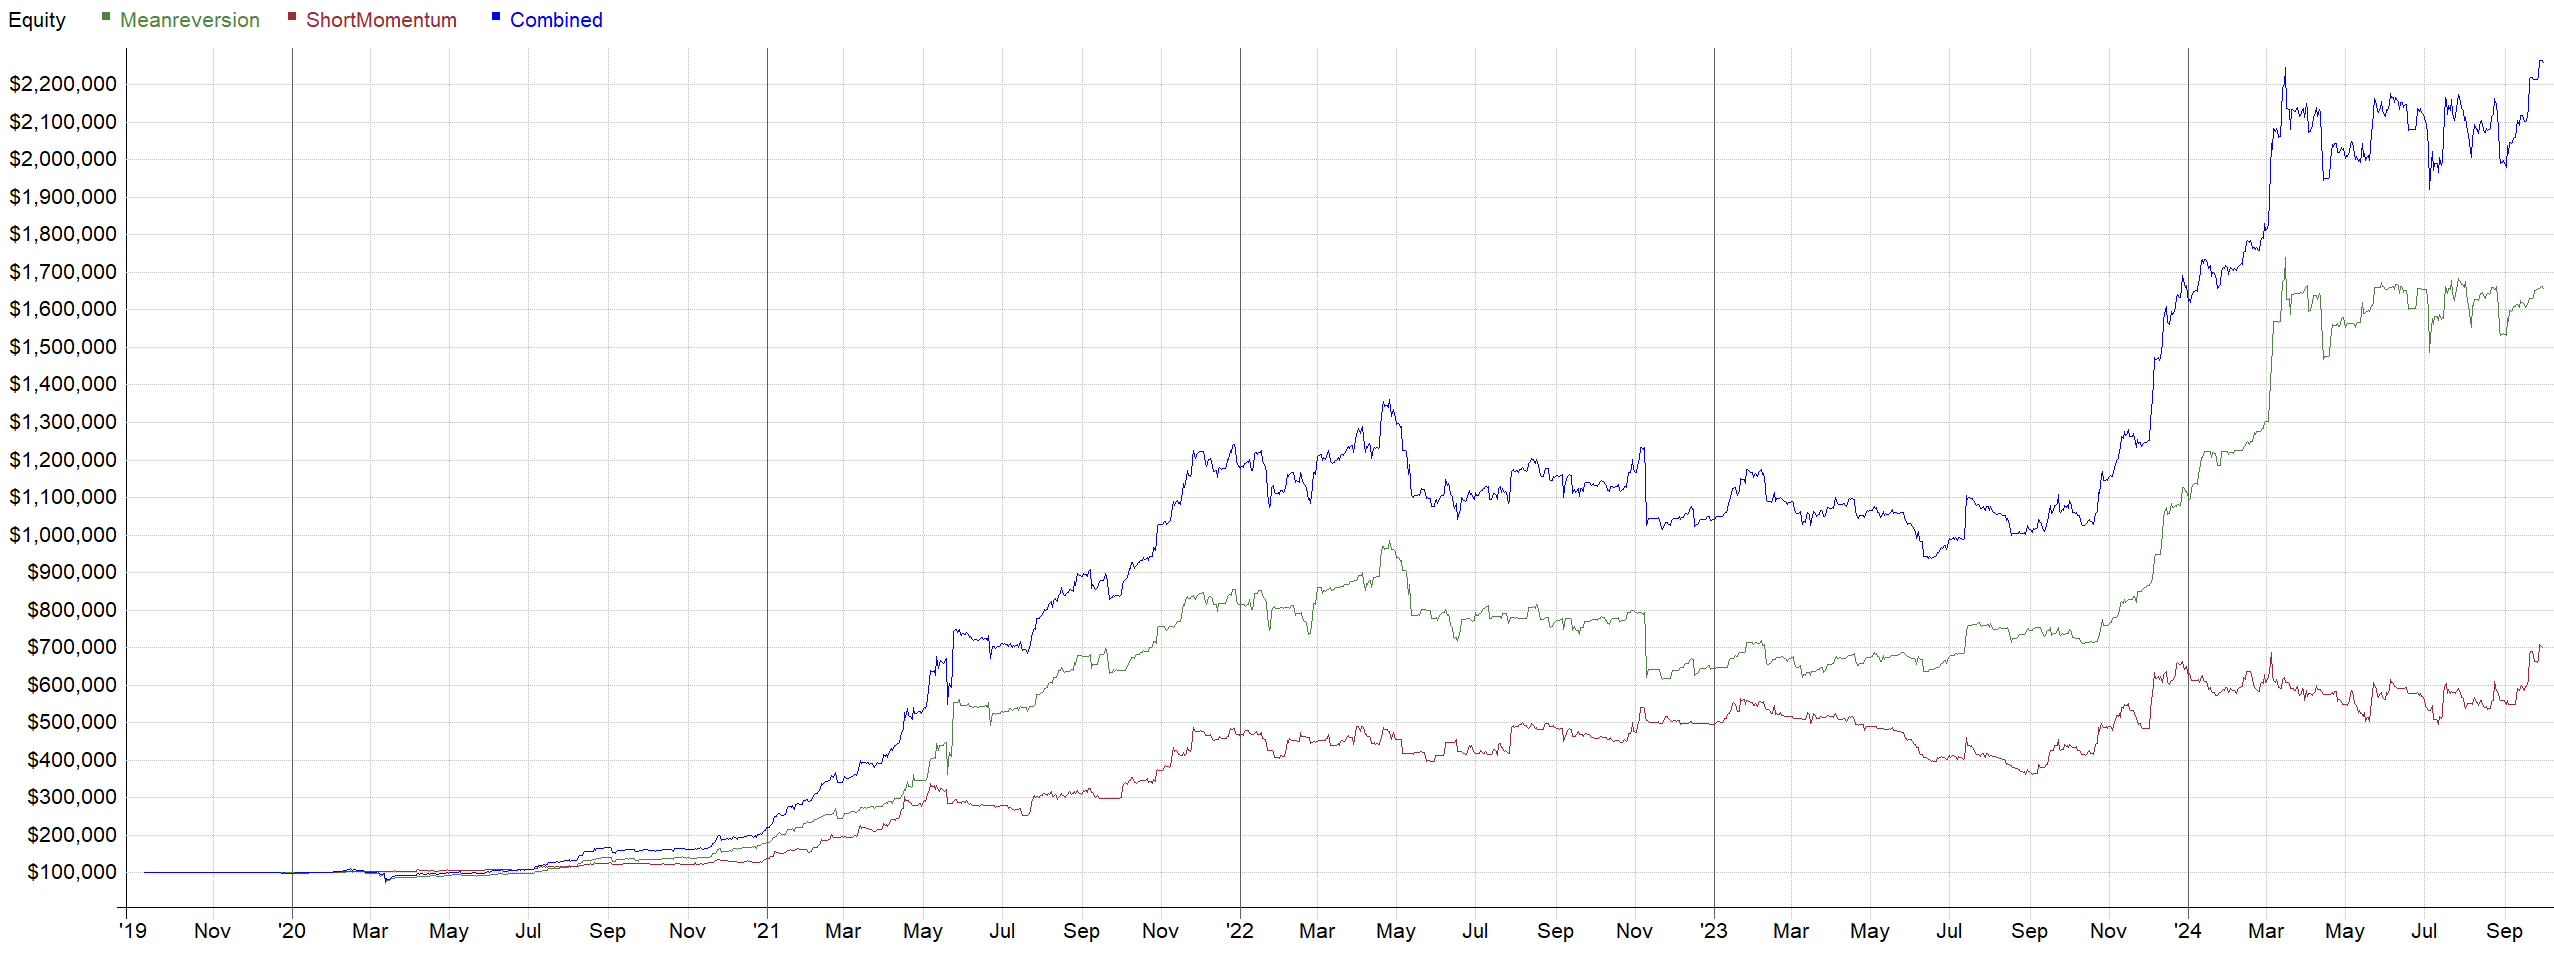
The Trend Portfolio made 113X, the Mean Reversion Portfolio made 5.4X.
However, when combined, they created a monstrous return of 500X, all while reducing the drawdown to just 15%.
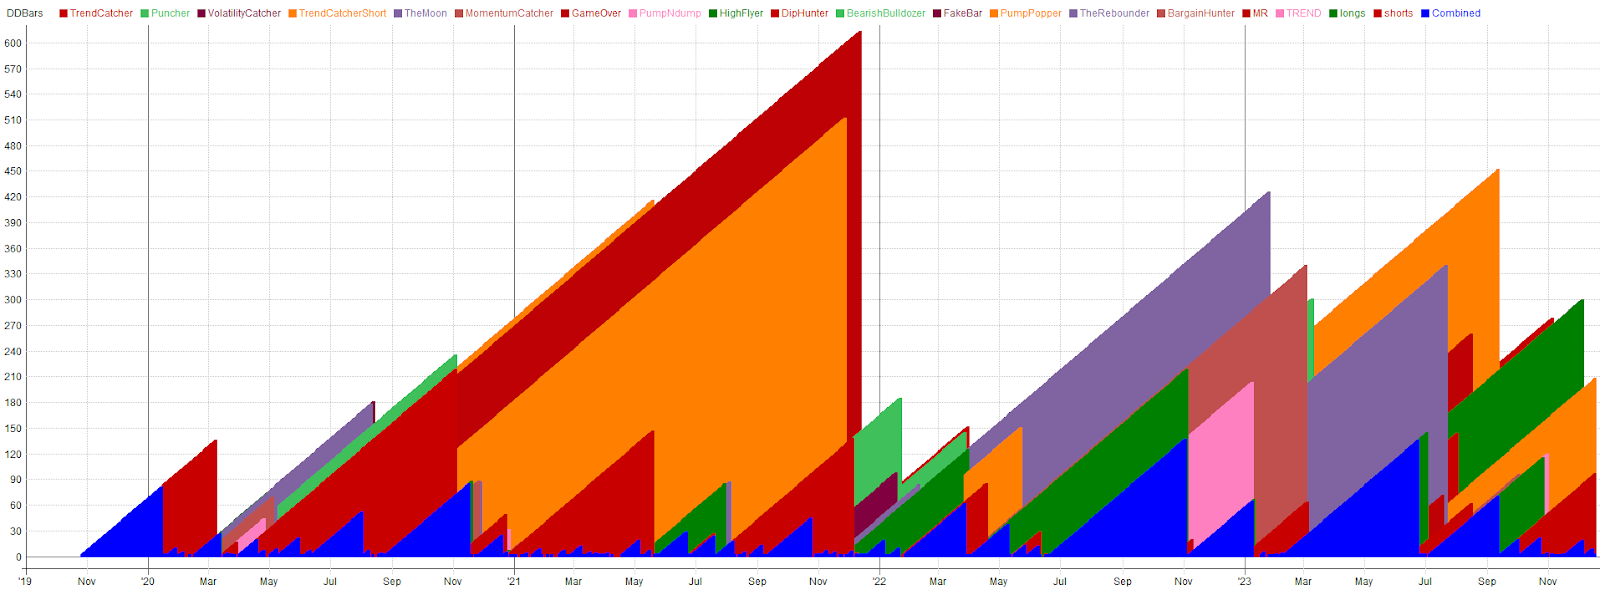
Also the duration of the drawdowns in the portfolio is very short. Individual strategies may experience longer drawdowns, this doesn’t really matter because we have other strategies profitable during these periods.
Once you understand the power of this you will finally be released of your urge to create overfitted strategies that perform in every market condition! We focus on very simple strategies that fulfill a specific task in our portfolio.
Again the correlations table. As you can see lot’s of negatively correlated strategies. This is exactly what you want to see.

Here is a list of all the strategies in our future portfolio:
Long Strategies
Trend:
- MomentumCatcher
- TheMoon
- HighFlyer
- Puncher
- VolatilityCatcher
- TrendCatcher
Mean Reversion:
- TheRebounder
- BargainHunter
- DipHunter
Short Strategies
Trend:
- TrendCatcherShort
- BearishBulldozer
- FakeBar
Mean Reversion:
- PumpPopper
- PumpNdump
- GameOver
As you can imagine, trading this portfolio is not a simple task. It requires an enormous and robust infrastructure to enable automated trading of this nature. We dedicated 1.5 years to building this infrastructure, and we continue to enhance our service every day!
This is precisely the service we offer at Robuxio.com. We trade broad portfolios of low-correlated or uncorrelated strategies for our clients in a robust way!

