A robust strategy is a simple and logical one that makes money in market conditions it is designed for and loses or breaks even in market conditions it’s not. Because it is so simple and its parameters aren’t exactly fit to the historical data, it should continue to perform well even if market environments change slightly.
Backtesting is critical for developing such a trading strategy, as it helps determine whether our predefined rules for making trading decisions have an edge and are robust.
However, backtesting software can be a dangerous tool for beginners. They often stack indicator upon indicator, allowing optimizing software, or as it’s now called, AI, to generate “perfect” parameters. In an attempt to enhance backtest profitability, they may also opt for lower time frames. The logic seems sound: lower time frames enable more trades, theoretically leading to quicker wealth. They continue “improving” their strategy until they achieve a 100%.
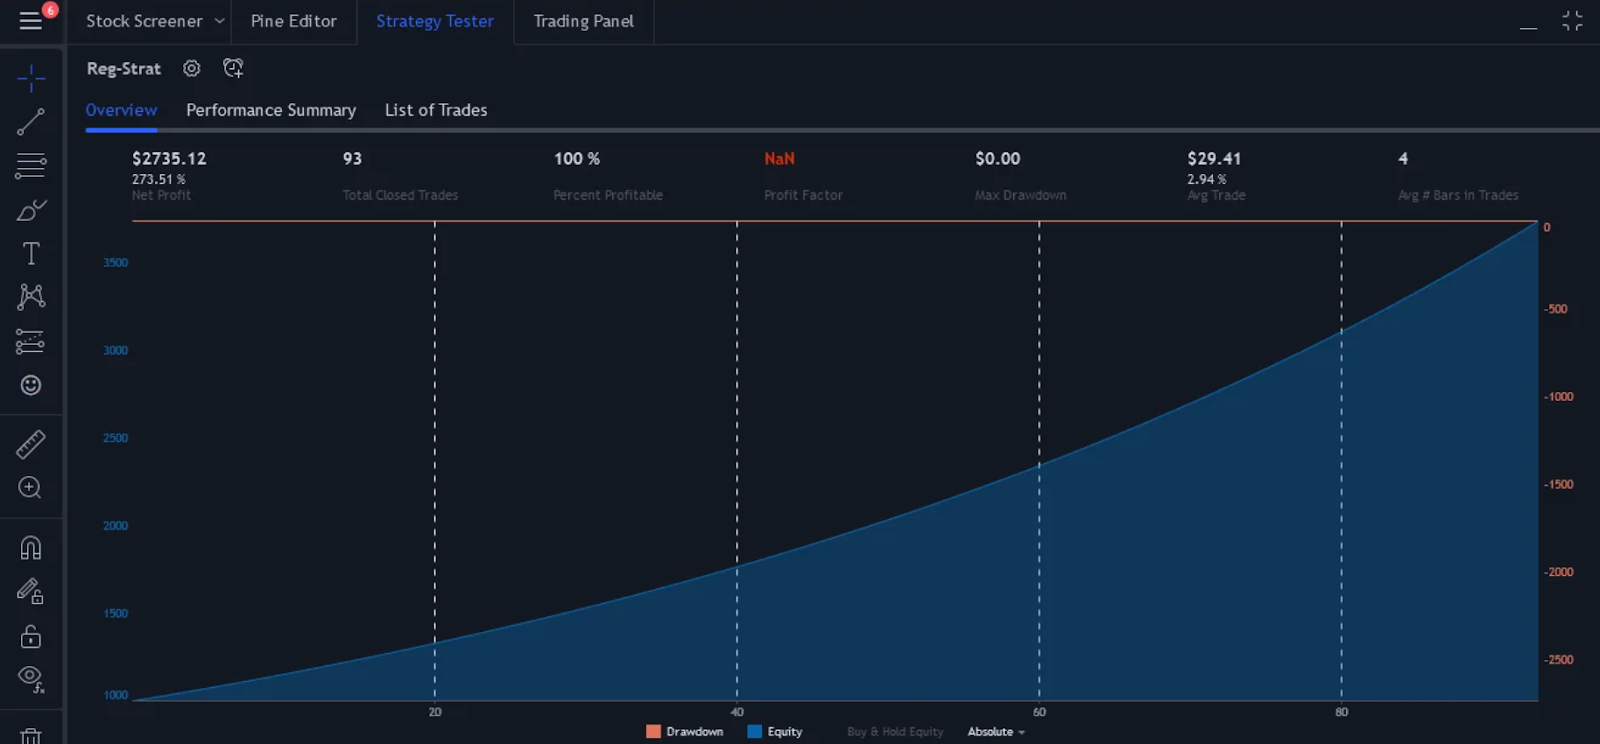
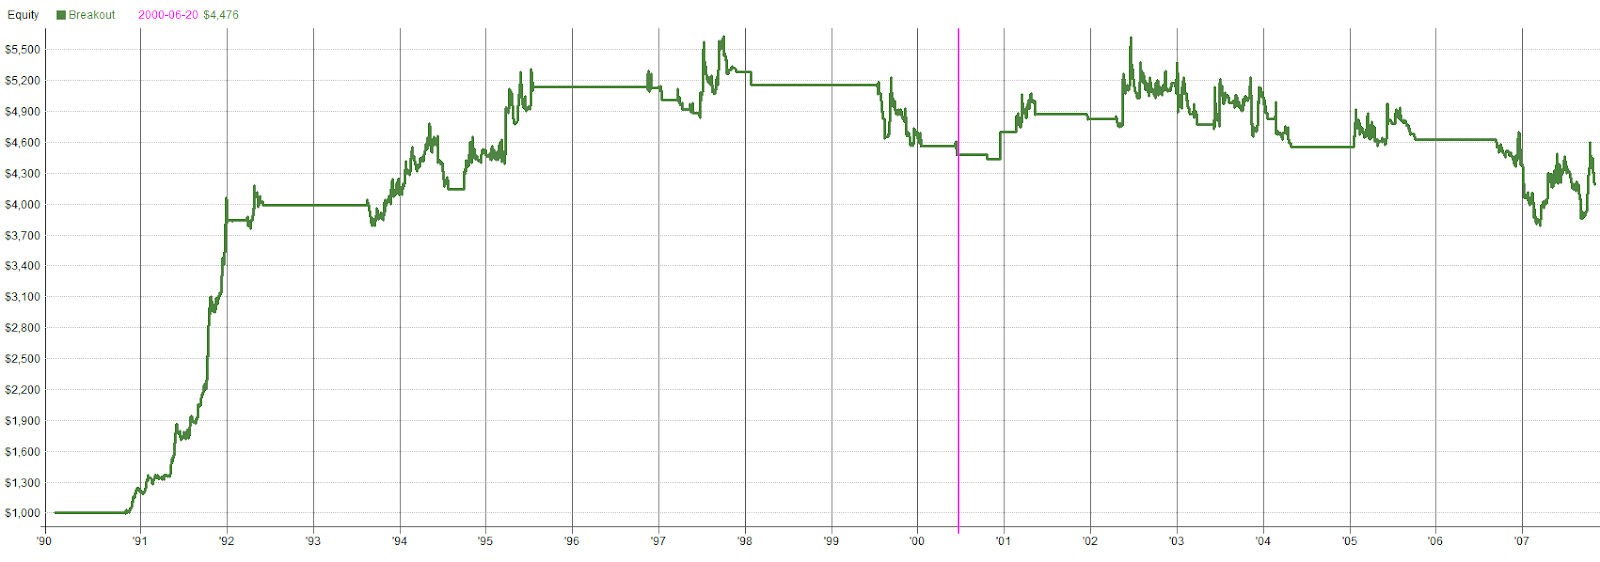
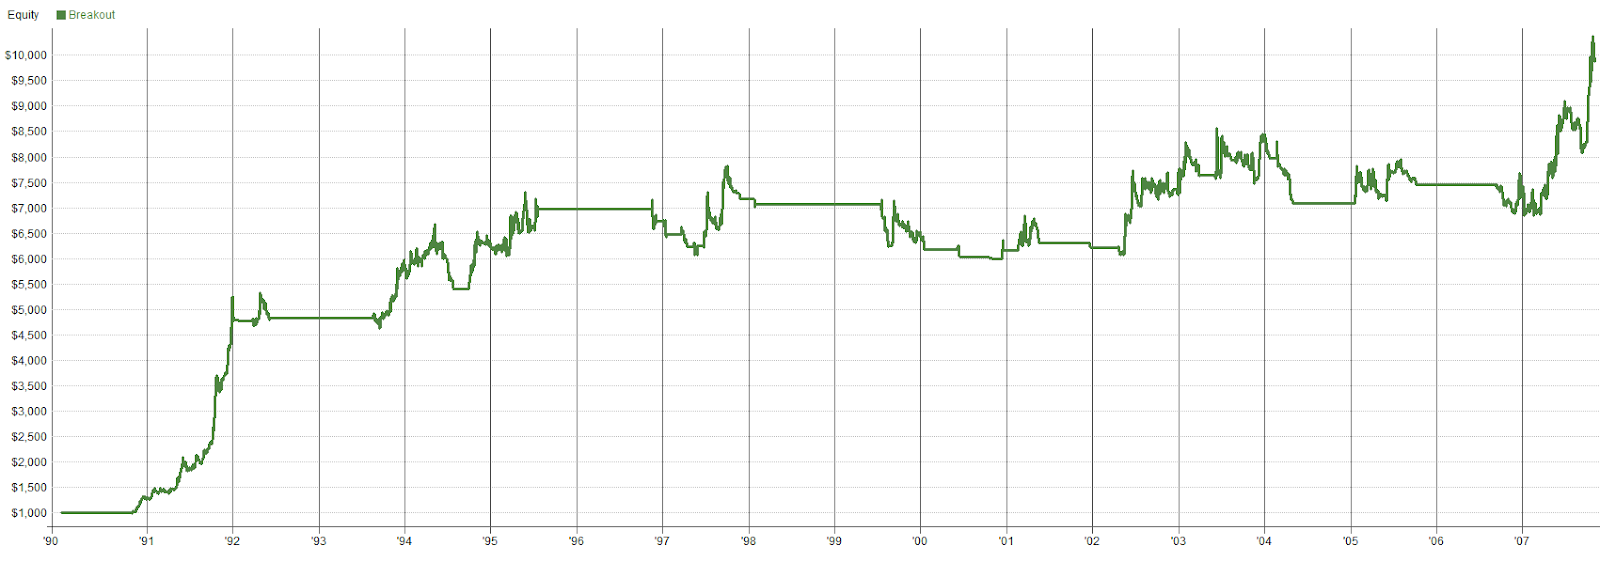
Look at the results of a 5-minute timeframe backtest with perfectly fitted parameters to historical price action on a single symbol. Unfortunately their live account will look like this, probably even worse:
When experienced traders encounter a backtest that is too good, they ask themselves what they’ve overfitted, whereas beginners wonder which Lamborghini they will order.
No one can predict the future, but one thing is certain: the future will never replicate the past exactly. Therefore, don’t model your strategy as though it will!
If you haven’t read our blogs on trading biases or curve fitting, please do so before proceeding.
How Do You Know If a Strategy Is Robust?
There are several general criteria for system robustness:
- Can it be described in simple and logical terms?
- Can you answer why it makes money?
- Is it profitable across multiple coins?
- Does it have a wide range of profitable parameters?
- Is it profitable on various timeframes?
Case Study: Breakout Trading Strategy
In blog VI about breakout trading, we created a simple breakout strategy. Let’s assess its robustness.
We learned that the very basics of a breakout strategy are the following: it needs to break through a level of a trading range, and we only hold it for a short time. So we made rules that reflect that:
Entry: The highest high of the last 30 days, with BTC above its MA50 as a regime filter.
Exit: After 3 days at the close.
As you can see we can describe the strategy in very simple and logical terms and we know exactly when and why the strategy should make money! If the price breaks through the 30-day high and keeps going for 3 days we will make money.
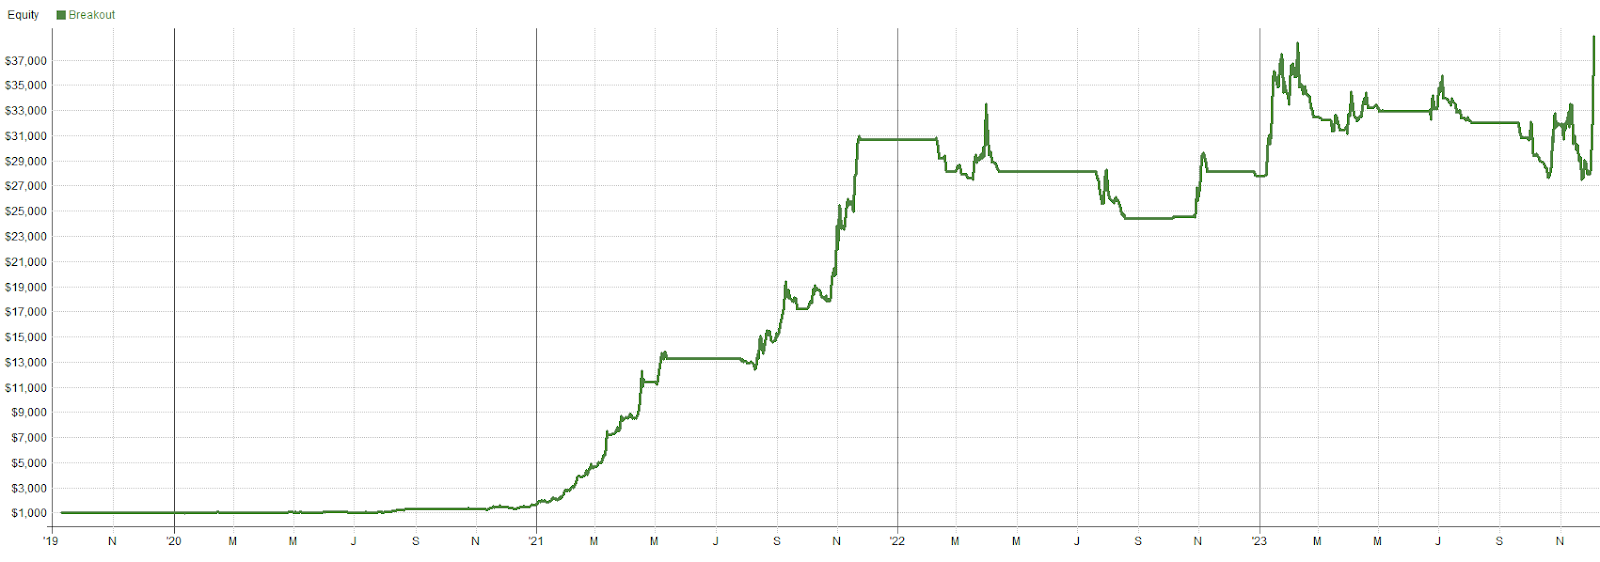
Let’s immediately test it on the whole liquid universe so we can also check if it’s tradeable on multiple coins:
Nice definitely works on multiple coins!
During the 2021 bull market, it performed exceptionally well. In the bear market, it encountered some failed breakouts and experienced whipsaw. At the beginning of 2023, it successfully captured the short January rally but then struggled in a low volatility sideways market with numerous false breakouts. Recently, we’ve seen another uptick as the market broke out consecutively for a few days.
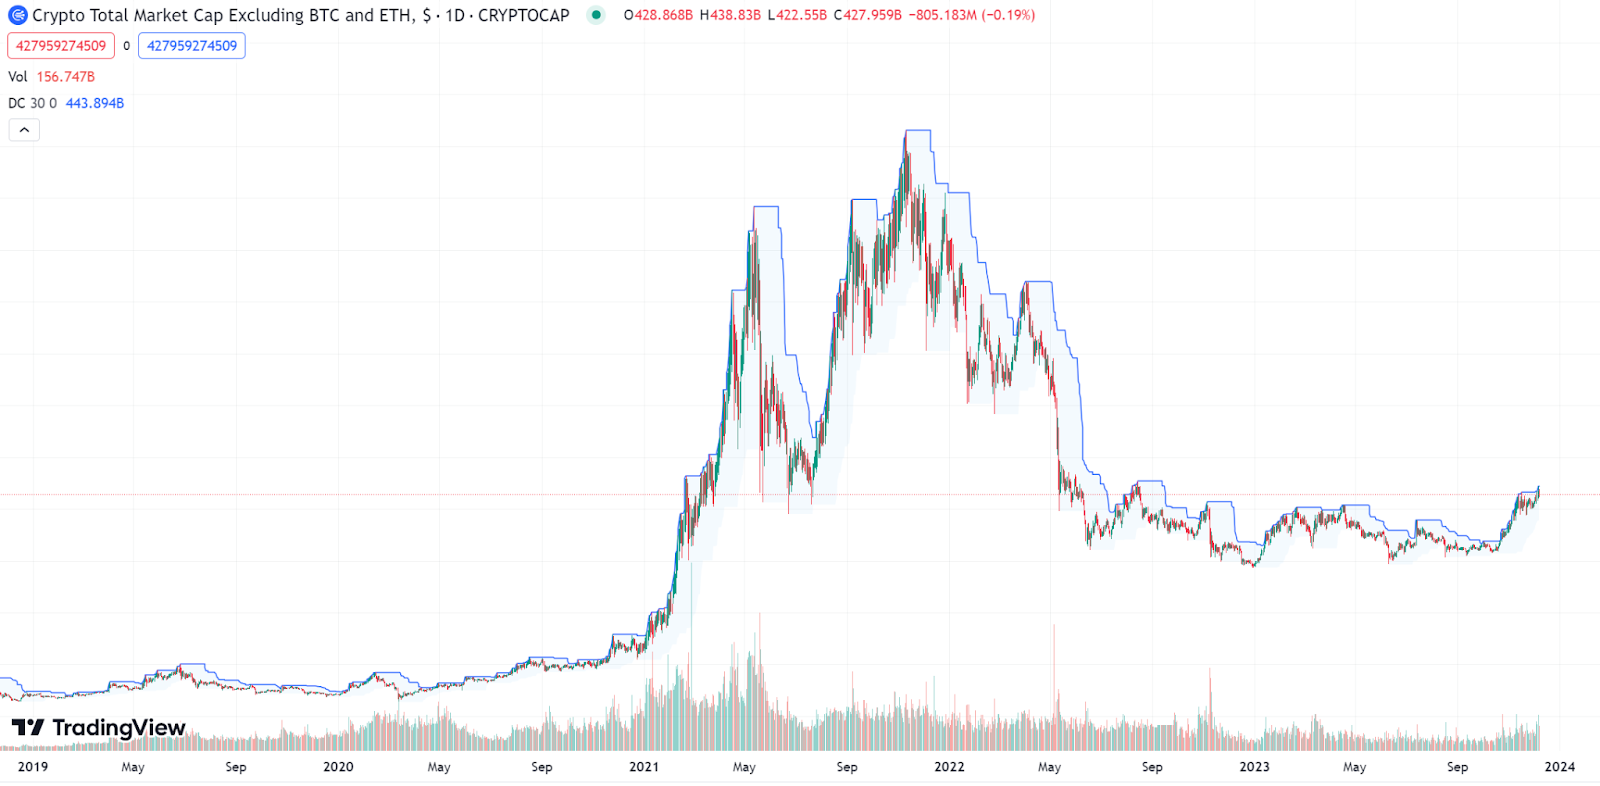
Let’s double check our findings by looking at the total market cap excluding BTC and ETH with our 30-day high channel marked on it.
The chart confirmed our observations from the backtest: The strategy only profits when the market breaks out of the channel and continues for a few days; it remains flat during market downturns, and we incur losses during false breakouts.
Let’s consider the robustness of these parameters. Imagine if we were to buy into the 31-day breakout and the strategy completely fell apart; that would not be very robust. Although it’s highly unlikely with the approach we took to build the strategy, starting with a clear idea first, it still serves as a good test of robustness. A strategy that is curve-fitted would definitely fail this test.
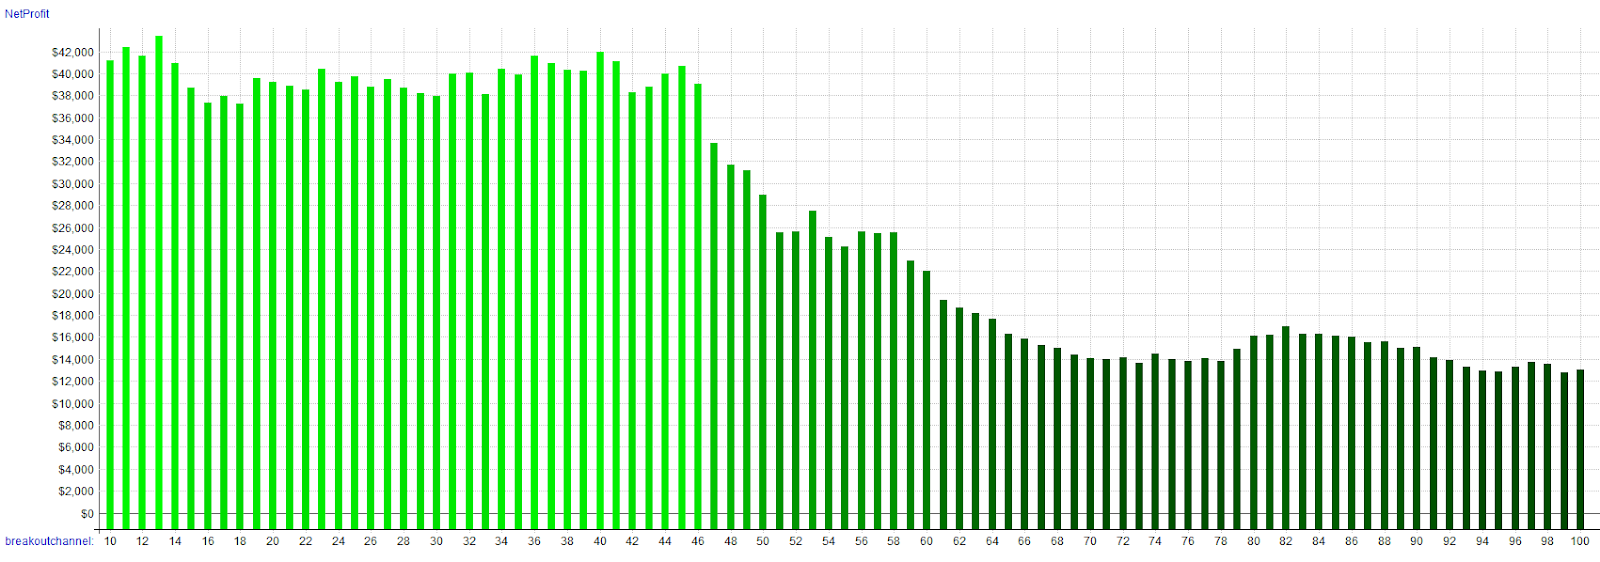
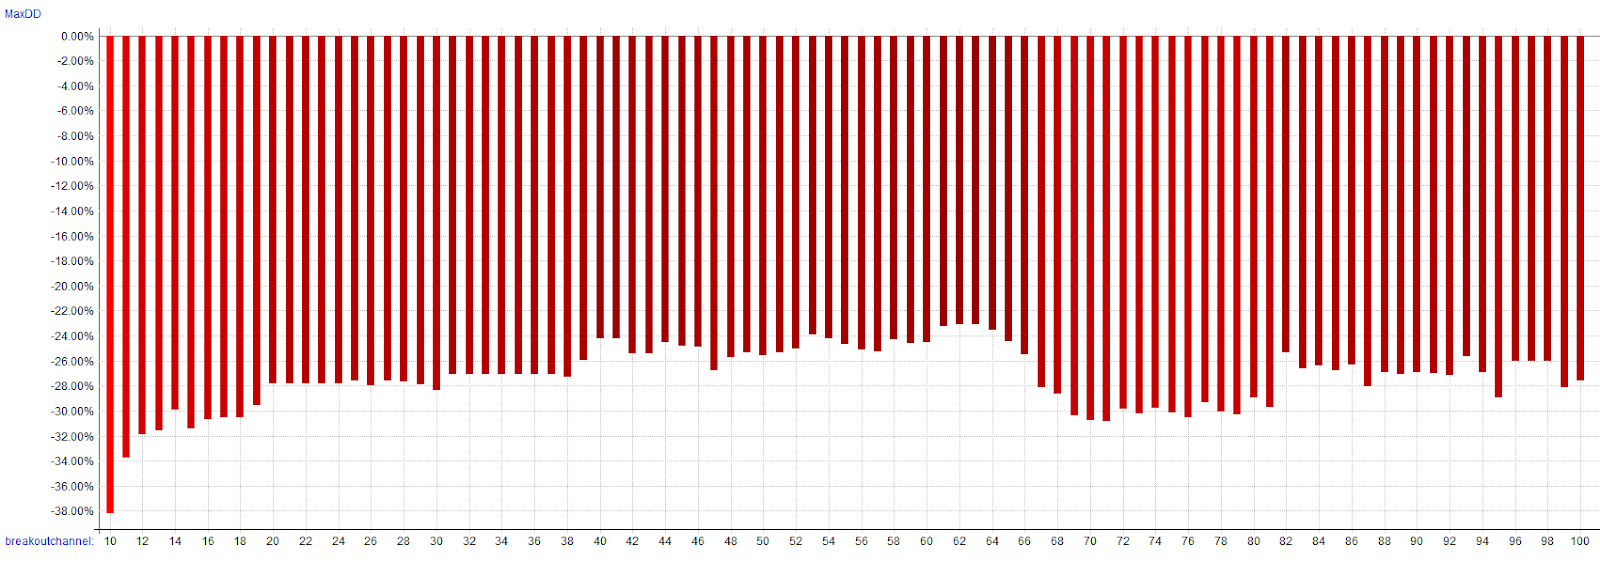
To test the range of profitable parameters we can conduct backtesting on the strategy using breakout periods ranging from 10 to 100 days high:
The results show that all channel high parameters were profitable, from the 10-day breakout to the 100-day breakout, with 30 days being around the midpoint of a stable range.
Same for the drawdown.
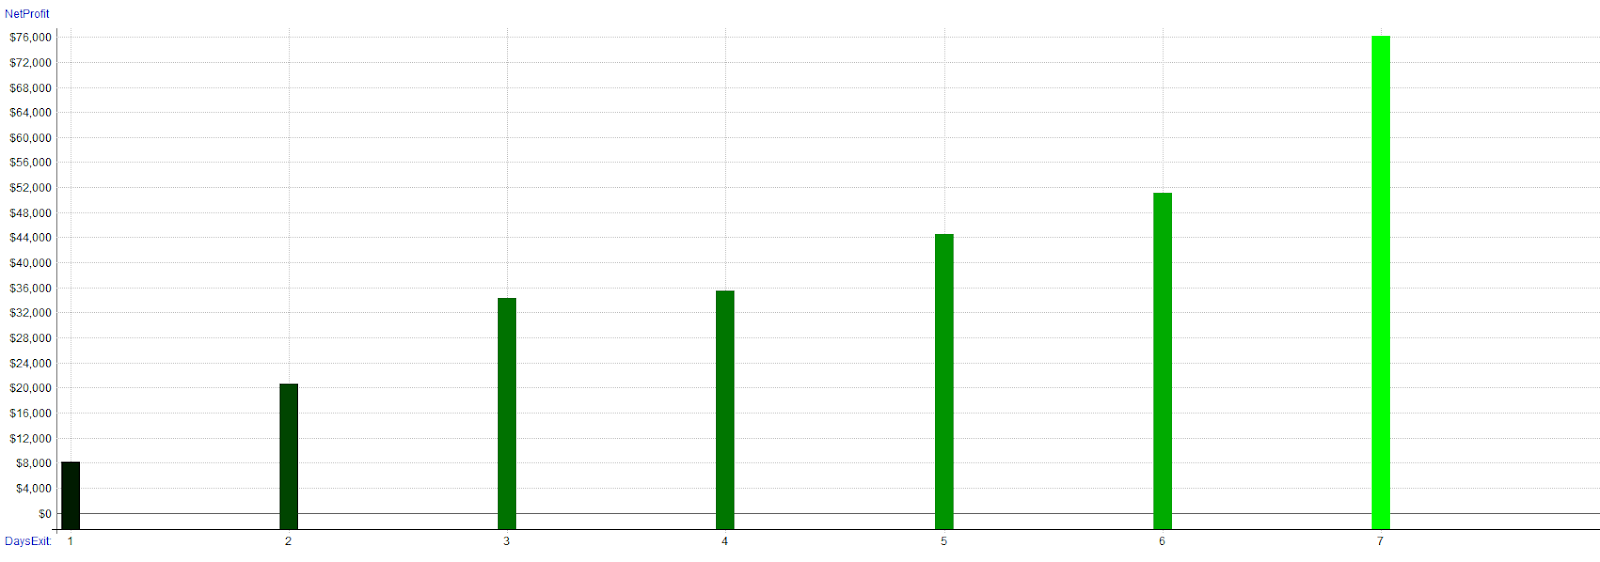
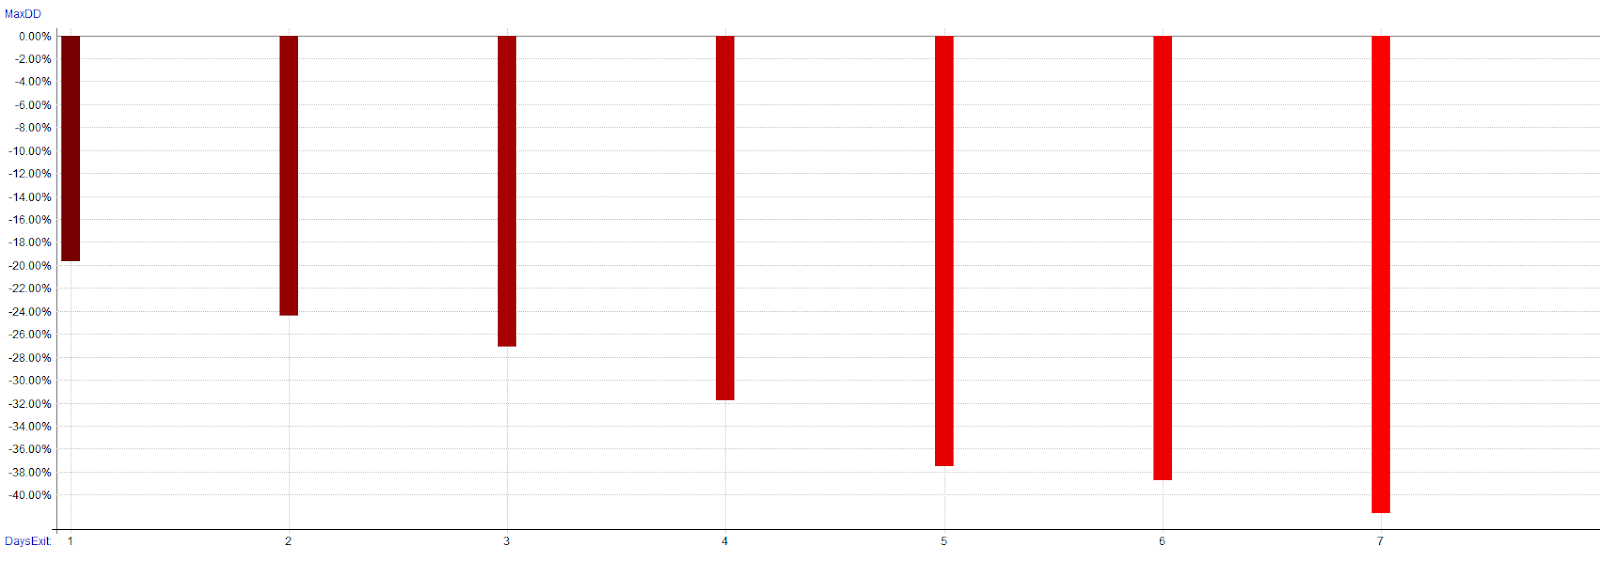
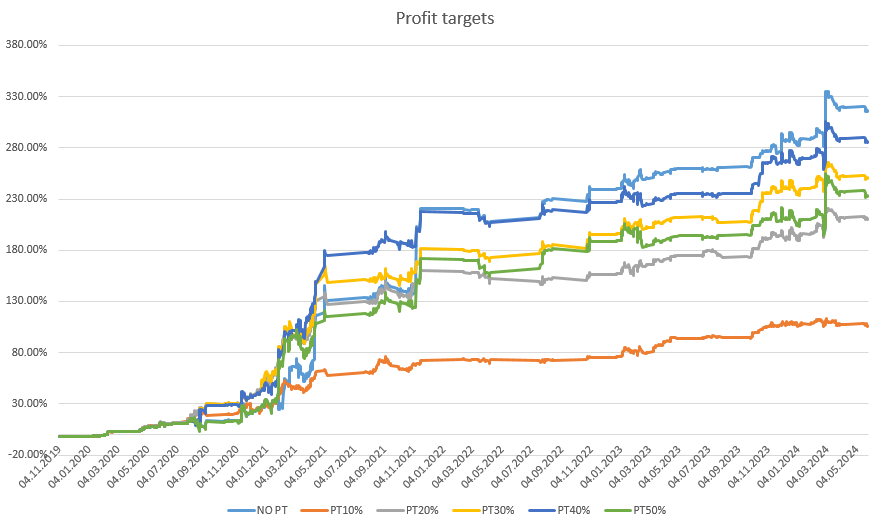
We can also check the exit. We know that breakout strategies are short term, so we used a simple time-based exit to confirm our strategy’s robustness. We tested holding periods ranging from 1 to 7 days.
Looks like the longer you hold the more profitable it becomes, but more reward comes obviously with more risk as you can see on the drawdown chart.
Given the limited historical data in crypto, strategies must be extremely simple and logical. Anything more complex is likely to fail.
Now we can move to the next test by running the backtest on a different timeframe, let’s test our strategy on 4-hour candles with the same breakout parameter of 30. I will only adapt the regime filter to 300ma to match the 50ma used on daily candles.
Results aren’t crazy good but seems to be working pretty stable even on 4h, but holding only for 3 bars is a bit short. Let’s try 6 bars instead, we need to give the breakout a little bit of time.
Looks to be profitable and stable, though not as profitable as on daily candles due to the shorter holding period. But very stable if you think we use the same parameters of a strategy with daily candles! The strategy didn’t fall apart at all, so it’s pretty clear that this strategy is robust enough to cope with a little change of market dynamics in the future. It is worth mentioning that with this test we are not aiming for the best results, only looking at the robustness.
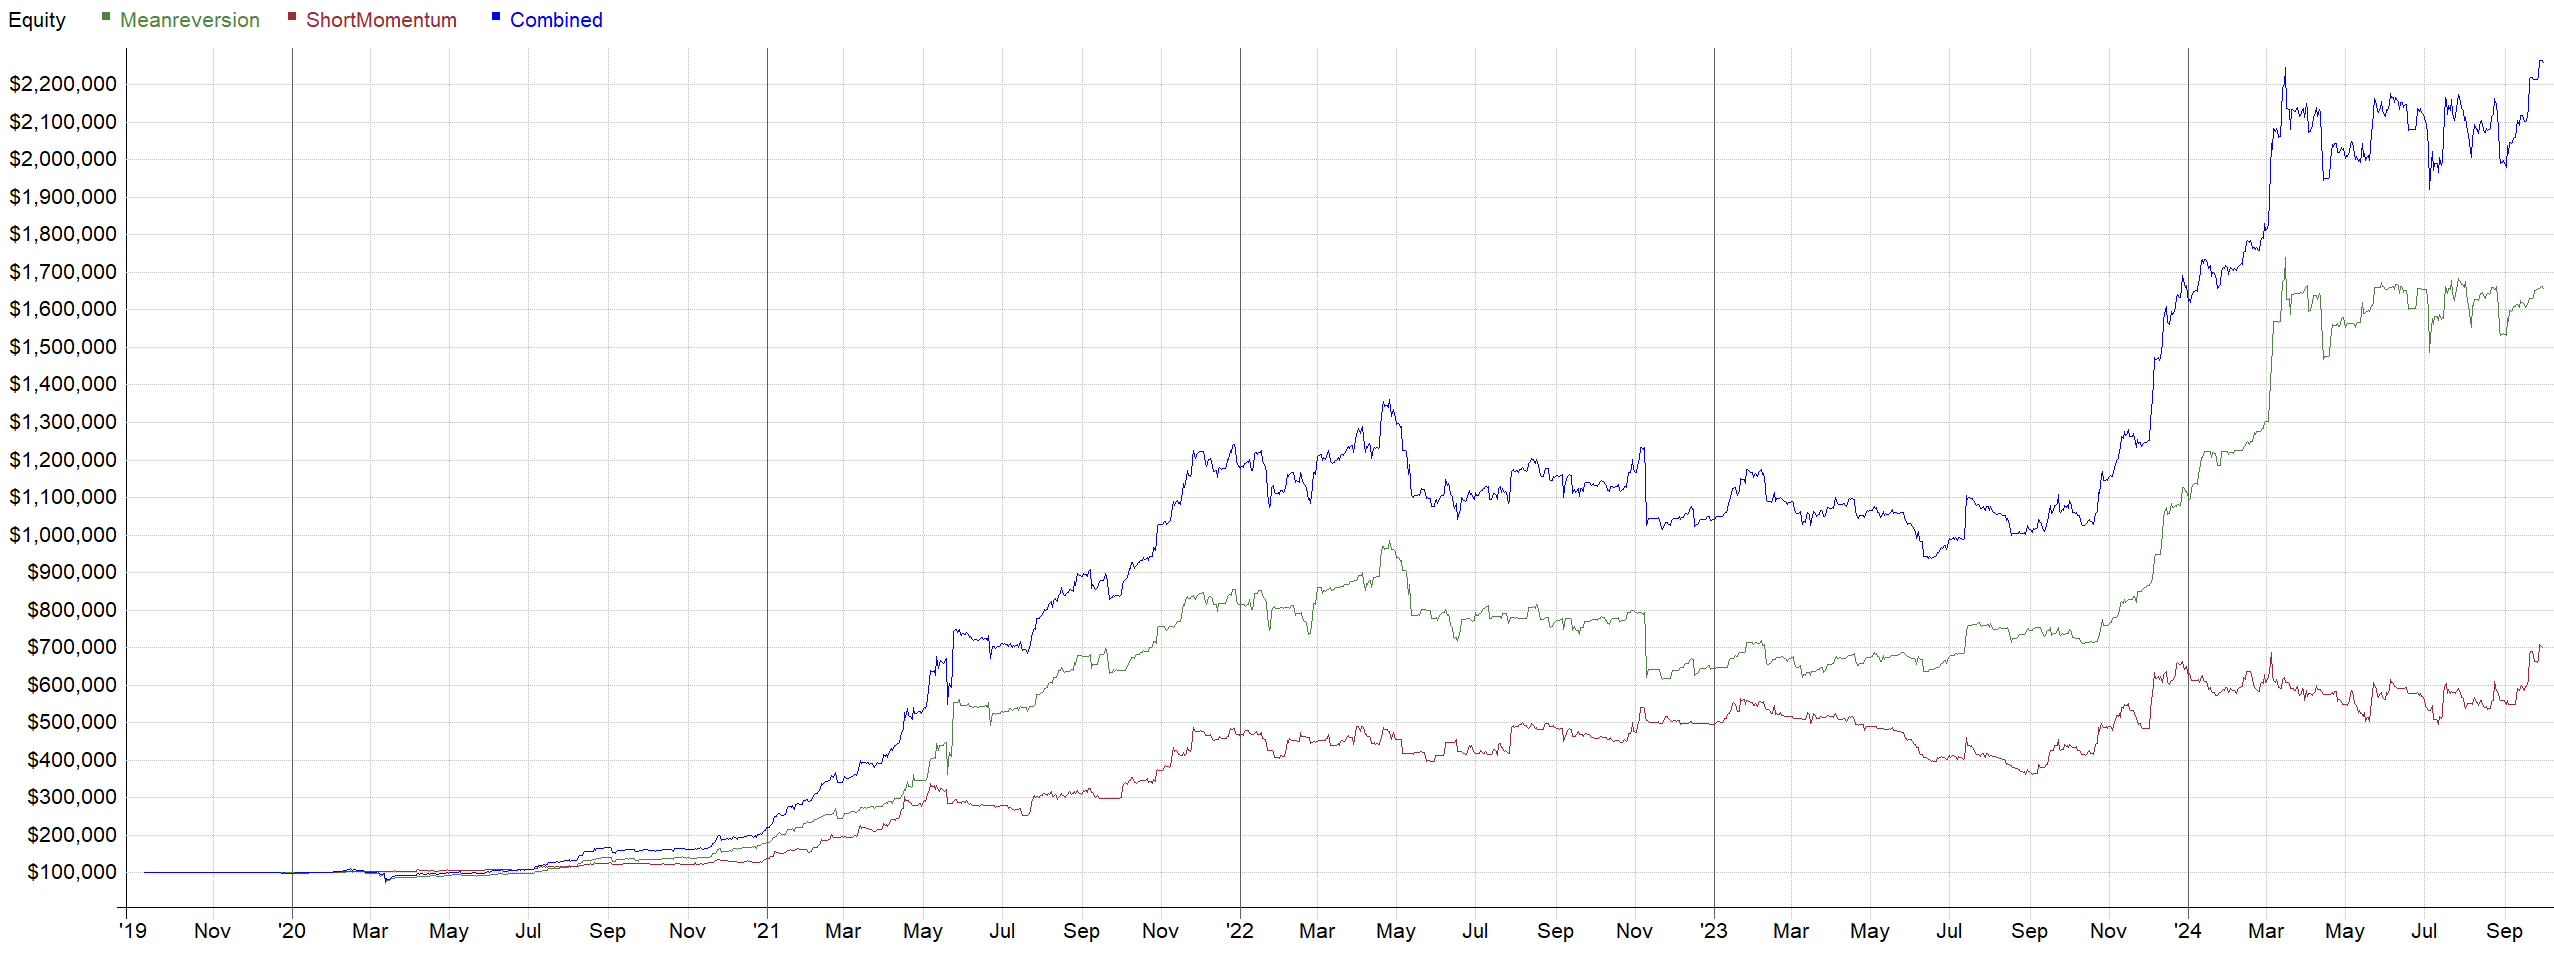
Let’s take it one step further and let’s test the complete medium portfolio we are currently trading here at Robuxio:
The robustness test on 4h candles:
Let’s also look at the portfolio with an increased amount of strategies that we are launching in the first quartal of 2024.
Now the robustness test on 4h candles:
Wow! Looks robust to me 🙂
There is one strategy that fails on the 4-hour timeframe, as it’s quite an aggressive breakout strategy, which can be overkill for 4h. However, as you can see in a portfolio of uncorrelated strategies, one failing strategy isn’t a big deal at all.
There are of course more factors like slippage, average profit etc. you should look at when making a robust strategy but the very basics are described in this blog post.
Here is a small bonus for you:
In the previous blog we made a very simple idea first approach RSI breakout strategy.
Entry: RSI(7) > 80, with BTC above its MA50 as a regime filter.
Exit: RSI(7) < 70
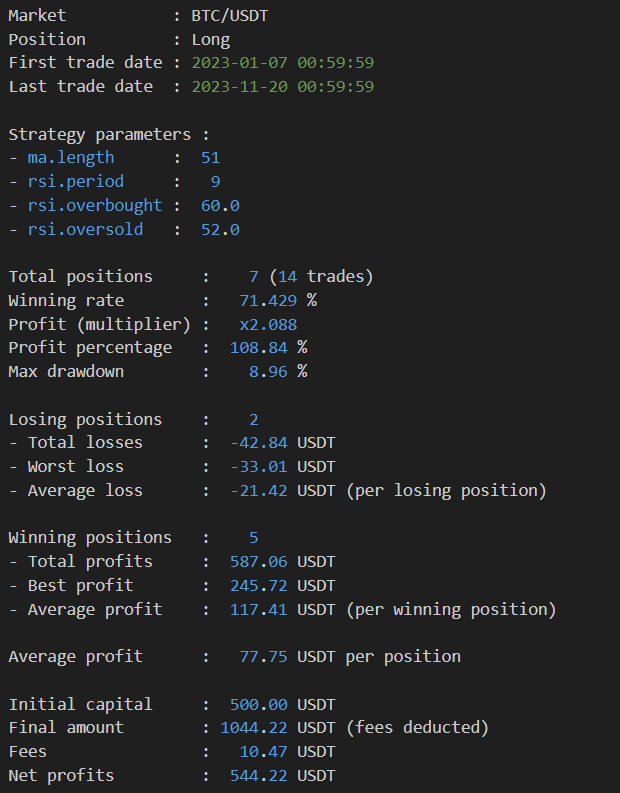
Based on that article I received from a reader an email all proud of how he optimized that strategy using his custom build optimizing backtesting software.
The software has identified in 1,750,000 backtests the optimal parameters as:
Entry: RSI(9) > 60 and BTC regime filter of 51MA
Exit: RSI(9) < 52
I encourage you to send everything that is wrong with this backtest at pavel@34.240.121.56 or a Twitter DM. Consider this a challenge to apply what you’ve learned from our series so far!
Conclusion
To sum it up, stay away from low timeframes, stay away from the optimizers. Start with an idea first, something you observe in the market and then try to explain it with simple terms. Then apply an indicator. Sometimes you don’t even need an indicator. Resist the temptation to tweak your strategy to avoid some bad trades or to include some exceptions so you would not have missed a good trade. This will always lead to overfitting.
Remember, single strategies don’t need to perform all the time; we trade a complete portfolio of uncorrelated strategies for a reason!
Our next blog post will discuss the portfolio construction of uncorrelated strategies…

