A trading strategy is the method of buying and selling in markets that is based on predefined rules used to make trading decisions.
The process of creating those robust and reliable trading rules requires a combination of basic rules and experience. Traders must go beyond simply stacking indicators on historical data but take a thoughtful and methodical approach to create strategies that could be profitable in live trading.
Understanding the Nature of the Market
The foundation of any trading system lies in understanding the market in which it will be deployed. Different markets behave in distinct ways, and a strategy that works well in one market might not yield similar results in another. Therefore, before even considering indicators or specific trading rules, traders must first determine the characteristics of the market they wish to trade.
The cryptocurrency market is known for its volatile and trend-driven nature, making it a breakout market. On the other hand, some traditional equity markets may be more prone to mean-reversion behavior. Identifying the underlying edge of the chosen market is essential for developing a trading strategy that aligns with its dynamics.
How do you know if a market is more suitable for trend trading or mean reversion trading?
There are many tools for this. Personally, I prefer to test the market with a very basic strategy with one condition and see if it generates profits and how stable those profits are.
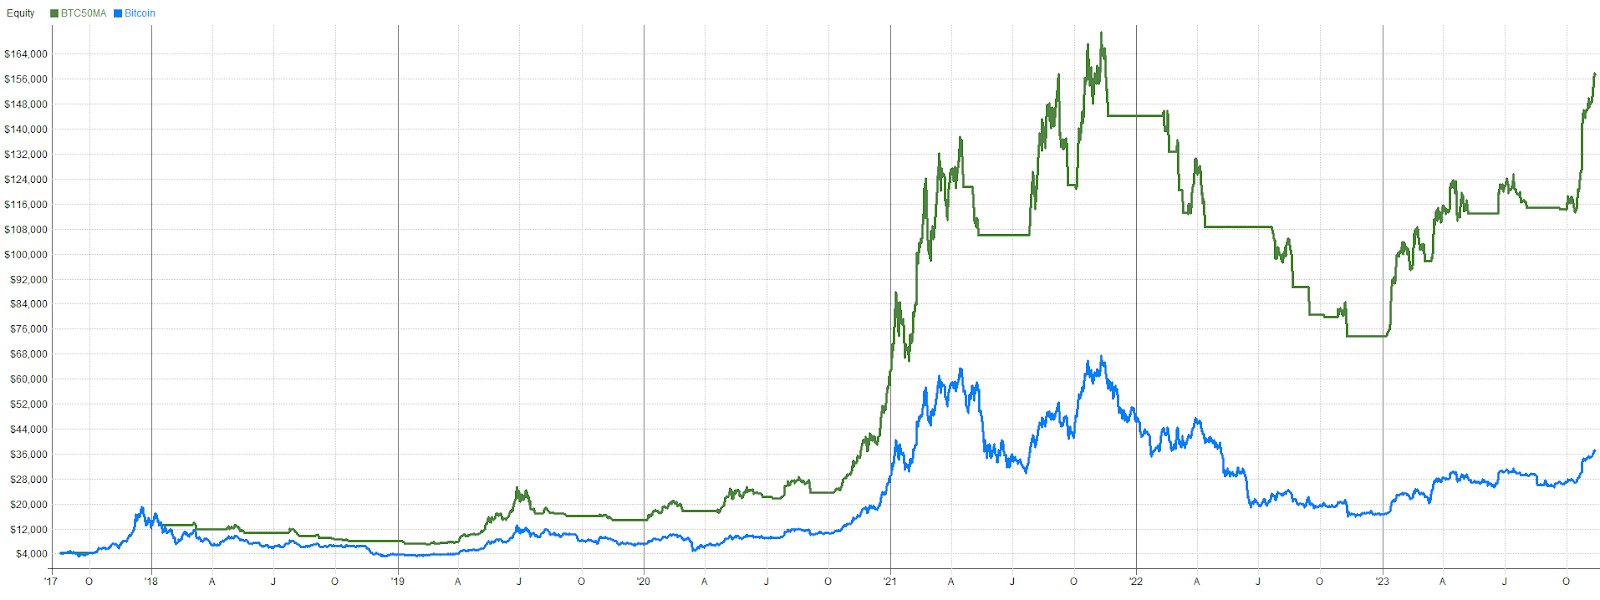
One of the most basic trend strategies is to enter based on a moving average. If the price closes above the 50-day moving average we enter. If it closes below it, we exit the trade.
You can find more information about this simple strategy here.
This strategy has generated almost 5 times more profit on Bitcoin than holding it. We can simplistically make the assumption that crypto is suitable for trend/breakout strategies.
Market Selection and Asset Allocation
Once the nature of the market is understood, you need to decide on the specific instruments you want to trade within that market. The question is: What set of cryptocurrencies to trade? Do you want to focus more on small coins? And why? What are their characteristics? Or do you want to trade the largest cryptocurrencies instead? It’s already quite a few different tests and you’re not even at building a specific strategy yet. Baseline tests should now follow again to figure out those questions.
Choosing the right set of cryptocurrencies is a vital step in constructing a diversified and balanced portfolio. Very small coins have slightly different characteristics than the largest tradable coins. Understanding them is key.
Analyzing Market Behavior
Understanding how the market behaves before and after specific events, such as breakouts, is fundamental to designing a strategy that capitalizes on potential price movements. Thorough research and analysis can help traders identify key patterns and trends that can be exploited for profit.
For instance, you can study historical breakouts and observe the price behavior leading up to the breakout event. How does the market behave during a breakout? What is its volatility? Describe everything. You need to know what structure you want to trade.
Indicator Selection and Parameters
Indicators can play a vital role in trading systems. However, they should not be the driving force behind a strategy. Instead, indicators should be used to describe the situations traders want to trade. The use of the indicator comes into play only when all the previous points are well known.
Let’s go to a specific example:
1. We have examined crypto as a whole. We know that there is a strong edge in the form of breakout and trend strategies.
2. We want to trade a breakout strategy. How does the market behave during successful
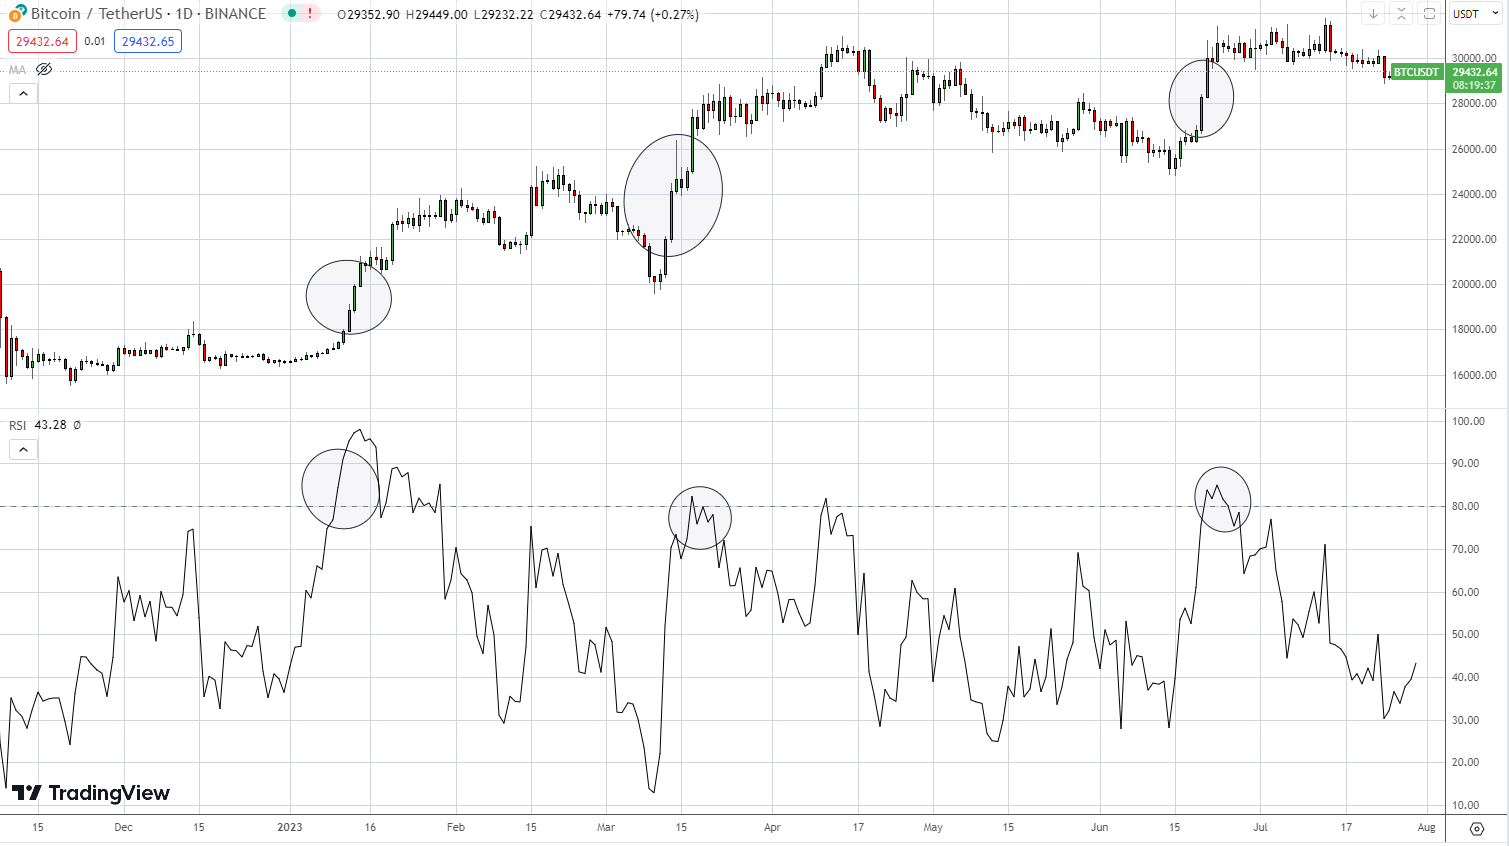
You can easily see that the strongest breakouts are marked by high daily volatility, visible as big daily candlesticks. If we know how a breakout happens, we can use technical analysis tools to describe it. This time we will describe it with the RSI (Relative Strength Index) indicator with a 7-day period. The RSI helps measure market momentum, typically oscillating between 0 and 100. It’s a quick way to get a read on the potential strength or weakness of a breakout.
The choice of the RSI with a period of 7 days is based on the desire to capture short-term breakouts.
At what levels is the breakout really strong? The chart shows that most of our strong breakouts occur around the 80 level. We will use it for our initial tests.
What exit to use?
There are many options. We will stick to a very simple strategy and use RSI for the exit as well. The basic premise is that we want to exit when momentum in the market weakens. The starting point for exiting the position could be the 60-70 level.
The basic rules of our simple system are as follows:
Entry: RSI(7) > 80
Exit: RSI(7) <70
We have now established the basic conditions. And this is the first time that we stop exploring the nature of the market and the entry situation and start testing the strategy itself.
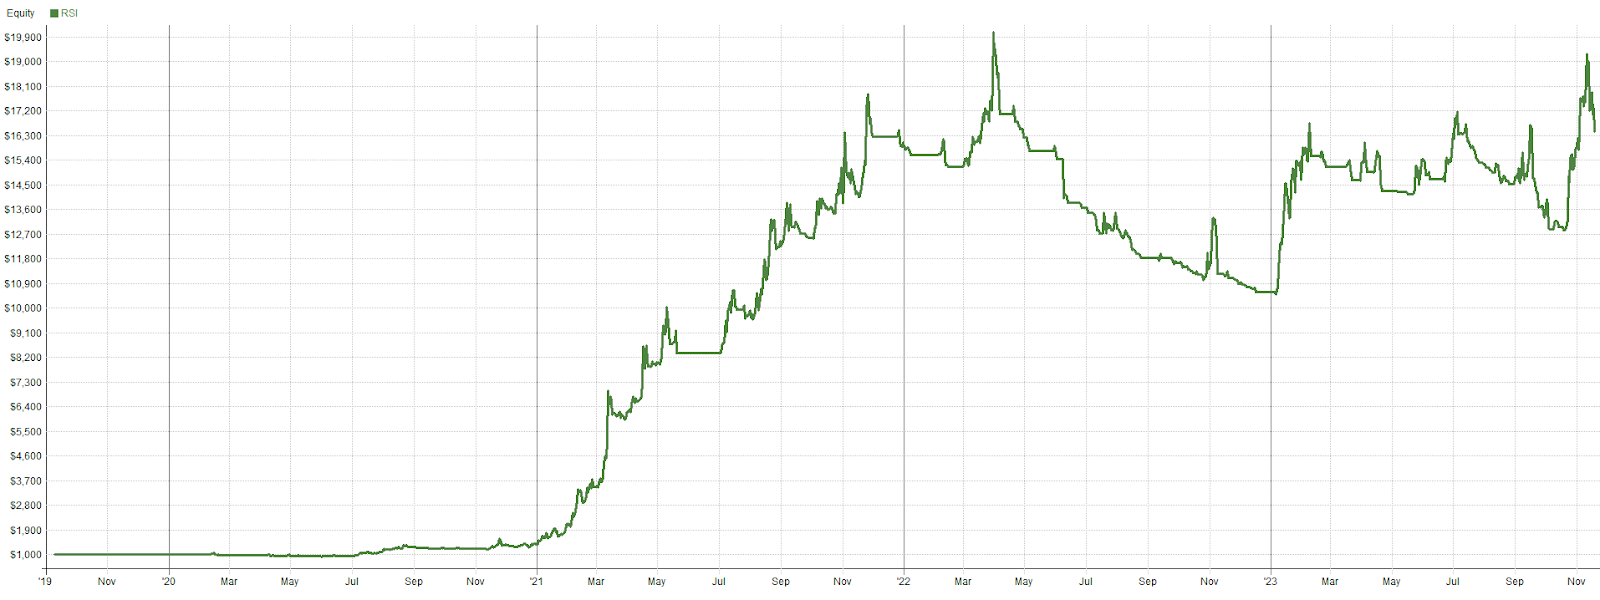
Let’s test our basic strategy on a portfolio of cryptocurrencies. We will enter a maximum of 10 positions at a time. We will use fixed percentage as described in our previous blog.
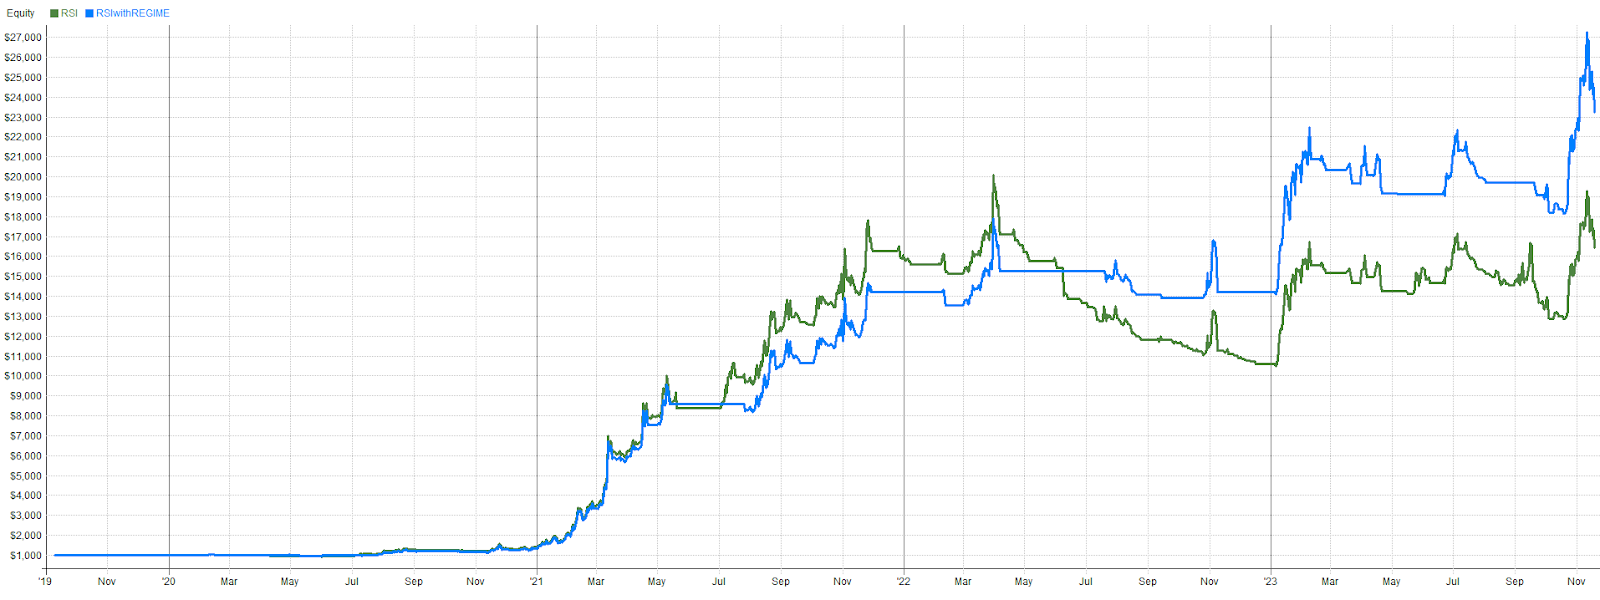
The strategy has a growing equity. The basic idea seems to work. However, I don’t like the results in a period when the markets are falling.
This brings us back to a key consideration. Our system is designed to trade breakouts on the long side. Therefore, it’s crucial to ask: should we be trading when the crypto market is trending downward? Probably not.
As Mark Minervini, one of America’s most successful stock traders, famously said: ‘To trade with ease, you must learn to wait patiently until the wind is at your back. Why not wait for a breezy day to set sail?’
To align our trading with this wisdom, we can implement a regime filter. This filter helps us to trade those quick breakouts with the ‘wind at our back.’ For more details on the regime filter, you can refer to our dedicated blog post.
A simple example of a regime filter is using a moving average on Bitcoin. Our strategy will be active when Bitcoin’s price is above its 50-day moving average, indicating an uptrend. Conversely, the strategy will be inactive when Bitcoin is below its MA(50), signaling a downtrend.”
What result does the context filter give us?
We can see that the result is significantly better. We have avoided the big drawdown in 2021 by using a logical context filter. By using Bitcoin’s moving average as a context filter, we ensure that we only enter trades when the broader crypto market is in a bullish phase, increasing the odds of success.
The basic strategy is therefore complete. It consists of only 3 conditions:
Entry: RSI(7) > 80 AND MA(BTC,50) > C
Exit: RSI(7) <70
Only 3 conditions can help create a strategy that has very interesting results.
But don’t be misled. The path to these 3 conditions was long, from understanding the market as a whole, to understanding the input situation, to actually testing the strategy.
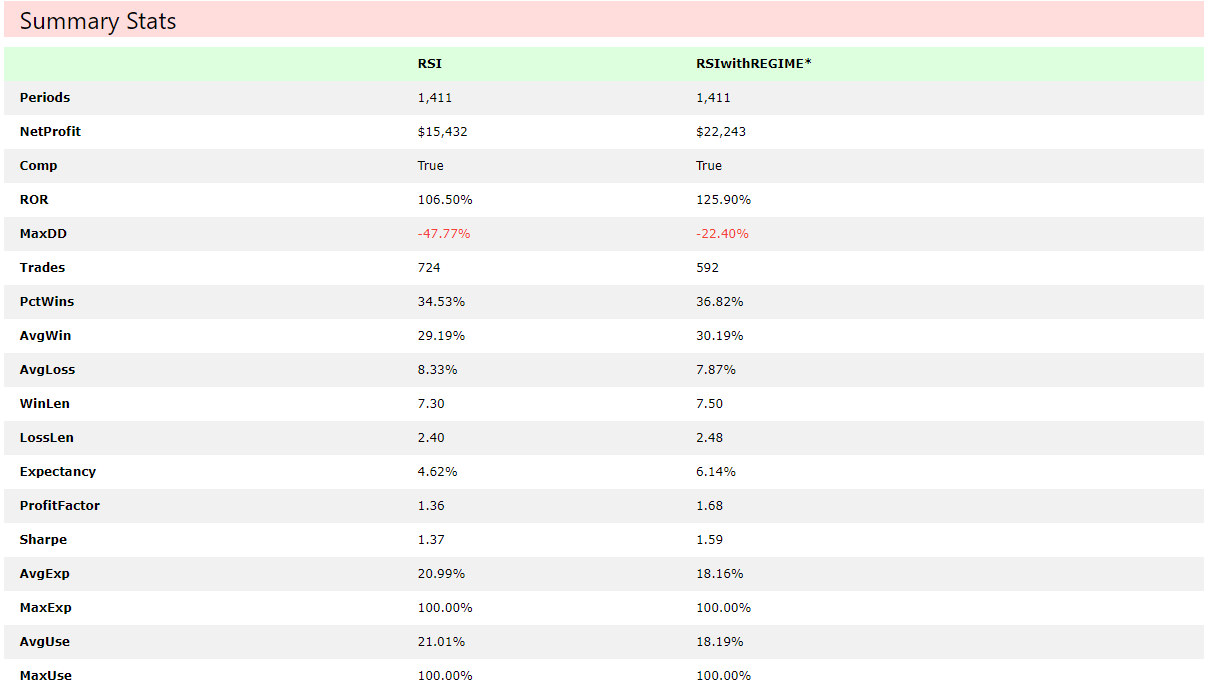
Here are the summary statistics for this strategy:
Conclusion
Building a profitable trading system is a multifaceted process that demands a combination of research, analysis, and critical thinking. Blindly stacking indicators on past data without a thorough understanding of the market’s nature and dynamics is a recipe for failure. Instead, successful traders approach strategy development as a scientific endeavor, carefully studying the market, selecting appropriate indicators, and using context filters wisely
Once you’ve built your strategy, don’t stop there. Put it through rigorous robustness tests to further increase the possibility of a profitable trading strategy in the live market. Don’t worry, this topic will be covered in a future article.
If you’re keen to try this strategy in Tradingview, we’ve got you covered. Just click here for the Pine Script code.

